

Answered step by step
Verified Expert Solution
Question
1 Approved Answer
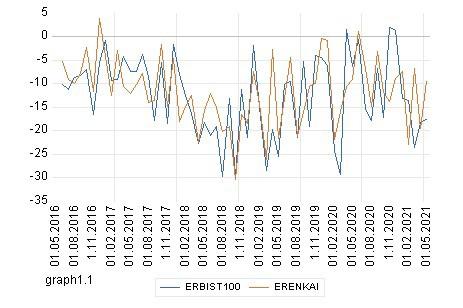
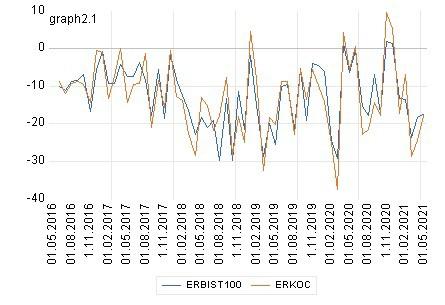
Estimate the CAPM betas for ALL stocks you see above. What are your conclusion ? EXAMINE ALL TABLES CAREFULLY AND EXPLAIN IN DETAILS . Thanks
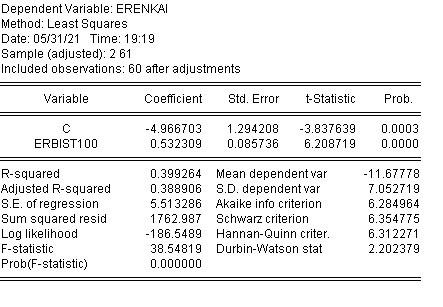
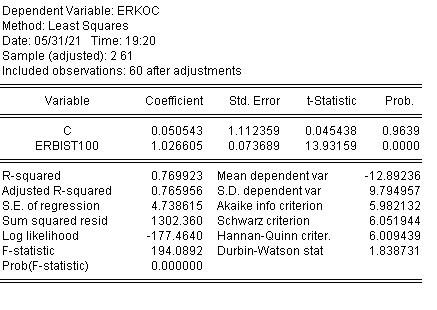
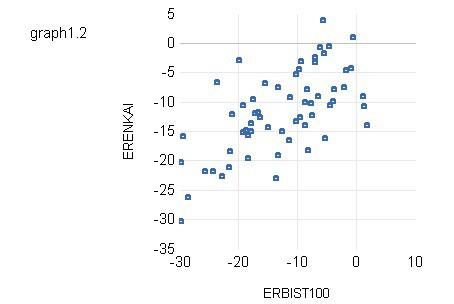
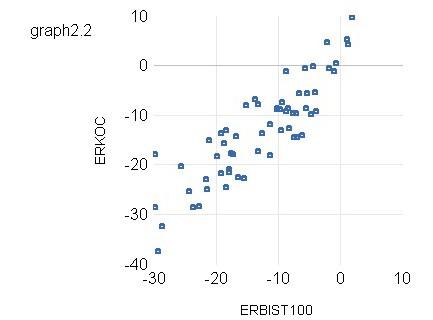
Estimate the CAPM betas for ALL stocks you see above. What are your conclusion ? EXAMINE ALL TABLES CAREFULLY AND EXPLAIN IN DETAILS .
Thanks for helping Sir
Dependent Variable: ERENKAI Method: Least Squares Date: 05/31/21 Time: 19:19 Sample (adjusted): 2 61 Included observations: 60 after adjustments Variable Coefficient Std. Error t-Statistic Prob. C ERBIST100 -4.966703 0.532309 1.294208 0.085736 -3.837639 6.208719 0.0003 0.0000 R-squared Adjusted R-squared S.E. of regression Sum squared resid Log likelihood F-statistic Prob(F-statistic) 0.399264 Mean dependent var 0.388906 S.D. dependent var 5.513286 Akaike info criterion 1762.987 Schwarz criterion -186.5489 Hannan-Quinn criter. 38.54819 Durbin-Watson stat 0.000000 -11.67778 7.052719 6.284964 6.354775 6.312271 2.202379 Dependent Variable: ERKOC Method: Least Squares Date: 05/31/21 Time: 19:20 Sample (adjusted): 2 61 Included observations: 60 after adjustments Variable Coefficient Std. Error t-Statistic Prob. C ERBIST100 0.050543 1.026605 1.112359 0.073689 0.045438 13.93159 0.9639 0.0000 R-squared Adjusted R-squared S.E. of regression Sum squared resid Log likelihood F-statistic Prob(F-statistic) 0.769923 Mean dependent var 0.765956 S.D. dependent var 4.738615 Akaike info criterion 1302.360 Schwarz criterion -177.4640 Hannan-Quinn criter. 194.0892 Durbin-Watson stat 0.000000 -12.89236 9.794957 5.982132 6.051944 6.009439 1.838731 5 graph 1.2 0 D -5 doo -10 ERENKAI -15 -20 D -25 -30 -35 -30 -20 -10 0 10 ERBIST100 10 graph2.2 D 0 - 10 ERKOC -20 -30 -40 -30 -20 -10 0 10 ERBIST100 5 01.05.2016 graph 1.1 ERBIST100 01.08.2016 1.11.2016 01.02.2017 01.05.2017 01.08.2017 1.11.2017 01.02.2018 01.05.2018 01.08.2018 1.11.2018 01.02.2019 01.05.2019 01.08.2019 1.11.2019 01.02.2020 01.05.2020 01.08.2020 1.11.2020 01.02.2021 ERENKAI 01.05.2021 -40 -30 -20 -10 0 01.05.2016 10 graph2.1 01.08.2016 1.11.2016 01.02.2017 01.05.2017 01.08.2017 1.11.2017 01.02.2018 01.05.2018 01.08.2018 1.11.2018 ERBIST 100 ERKOC 01.02.2019 01.05.2019 01.08.2019 1.11.2019 01.02.2020 01.05.2020 01.08.2020 1.11.2020 01.02.2021 01.05.2021 Dependent Variable: ERENKAI Method: Least Squares Date: 05/31/21 Time: 19:19 Sample (adjusted): 2 61 Included observations: 60 after adjustments Variable Coefficient Std. Error t-Statistic Prob. C ERBIST100 -4.966703 0.532309 1.294208 0.085736 -3.837639 6.208719 0.0003 0.0000 R-squared Adjusted R-squared S.E. of regression Sum squared resid Log likelihood F-statistic Prob(F-statistic) 0.399264 Mean dependent var 0.388906 S.D. dependent var 5.513286 Akaike info criterion 1762.987 Schwarz criterion -186.5489 Hannan-Quinn criter. 38.54819 Durbin-Watson stat 0.000000 -11.67778 7.052719 6.284964 6.354775 6.312271 2.202379 Dependent Variable: ERKOC Method: Least Squares Date: 05/31/21 Time: 19:20 Sample (adjusted): 2 61 Included observations: 60 after adjustments Variable Coefficient Std. Error t-Statistic Prob. C ERBIST100 0.050543 1.026605 1.112359 0.073689 0.045438 13.93159 0.9639 0.0000 R-squared Adjusted R-squared S.E. of regression Sum squared resid Log likelihood F-statistic Prob(F-statistic) 0.769923 Mean dependent var 0.765956 S.D. dependent var 4.738615 Akaike info criterion 1302.360 Schwarz criterion -177.4640 Hannan-Quinn criter. 194.0892 Durbin-Watson stat 0.000000 -12.89236 9.794957 5.982132 6.051944 6.009439 1.838731 5 graph 1.2 0 D -5 doo -10 ERENKAI -15 -20 D -25 -30 -35 -30 -20 -10 0 10 ERBIST100 10 graph2.2 D 0 - 10 ERKOC -20 -30 -40 -30 -20 -10 0 10 ERBIST100 5 01.05.2016 graph 1.1 ERBIST100 01.08.2016 1.11.2016 01.02.2017 01.05.2017 01.08.2017 1.11.2017 01.02.2018 01.05.2018 01.08.2018 1.11.2018 01.02.2019 01.05.2019 01.08.2019 1.11.2019 01.02.2020 01.05.2020 01.08.2020 1.11.2020 01.02.2021 ERENKAI 01.05.2021 -40 -30 -20 -10 0 01.05.2016 10 graph2.1 01.08.2016 1.11.2016 01.02.2017 01.05.2017 01.08.2017 1.11.2017 01.02.2018 01.05.2018 01.08.2018 1.11.2018 ERBIST 100 ERKOC 01.02.2019 01.05.2019 01.08.2019 1.11.2019 01.02.2020 01.05.2020 01.08.2020 1.11.2020 01.02.2021 01.05.2021Step by Step Solution
There are 3 Steps involved in it
Step: 1

Get Instant Access to Expert-Tailored Solutions
See step-by-step solutions with expert insights and AI powered tools for academic success
Step: 2

Step: 3
Ace Your Homework with AI
Get the answers you need in no time with our AI-driven, step-by-step assistance
Get Started
Petromania Black Gold Paper Barrels And Oil Price Bubbles
Authors: Daniel O'Sullivan
1st Edition
1906659249,190665977X