

Answered step by step
Verified Expert Solution
Question
1 Approved Answer
Estimate the following: a. WACC, b. NPV, c. IRR of the PE investor, d. Equity value e. price per share of SHL, using DCF method.
Estimate the following:
a. WACC,
b. NPV,
c. IRR of the PE investor,
d. Equity value
e. price per share of SHL, using DCF method.
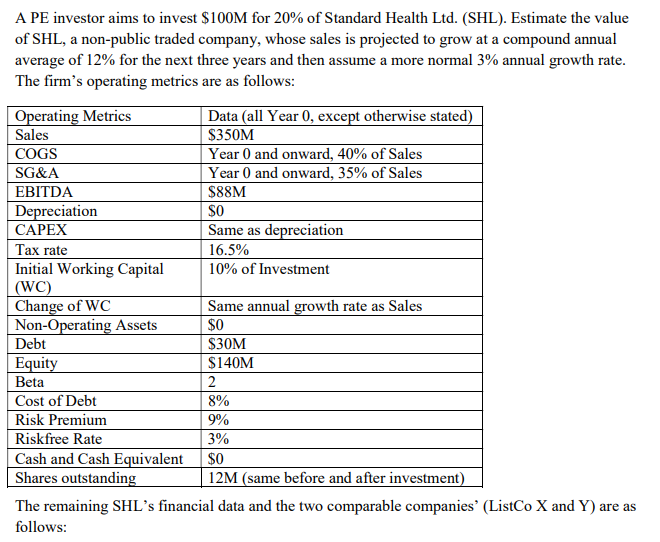
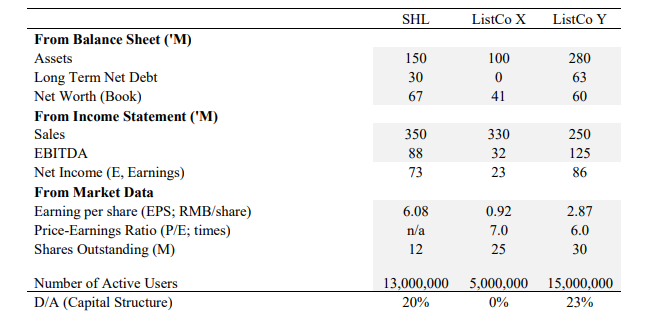
A PE investor aims to invest $100M for 20% of Standard Health Ltd. (SHL). Estimate the value of SHL, a non-public traded company, whose sales is projected to grow at a compound annual average of 12% for the next three years and then assume a more normal 3% annual growth rate. The firm's operating metrics are as follows: Operating Metrics Data (all Year (, except otherwise stated) Sales $350M COGS Year 0 and onward, 40% of Sales SG&A Year 0 and onward, 35% of Sales EBITDA $88M Depreciation SO CAPEX Same as depreciation Tax rate 16.5% Initial Working Capital 10% of Investment (WC) Change of WC Same annual growth rate as Sales Non-Operating Assets $0 Debt $30M Equity $140M Beta 2 Cost of Debt 8% Risk Premium 9% Riskfree Rate 3% Cash and Cash Equivalent $0 Shares outstanding 12M (same before and after investment) The remaining SHL's financial data and the two comparable companies' (ListCo X and Y) are as follows: SHL ListCo X ListCo Y 150 30 67 100 0 41 280 63 60 From Balance Sheet ('M) Assets Long Term Net Debt Net Worth (Book) From Income Statement ('M) Sales EBITDA Net Income (E, Earnings) From Market Data Earning per share (EPS; RMB/share) Price-Earnings Ratio (P/E; times) Shares Outstanding (M) Number of Active Users D/A (Capital Structure) 350 88 73 330 32 23 250 125 86 6.08 n/a 12 0.92 7.0 25 2.87 6.0 30 13,000,000 20% 5,000,000 0% 15,000,000 23% A PE investor aims to invest $100M for 20% of Standard Health Ltd. (SHL). Estimate the value of SHL, a non-public traded company, whose sales is projected to grow at a compound annual average of 12% for the next three years and then assume a more normal 3% annual growth rate. The firm's operating metrics are as follows: Operating Metrics Data (all Year (, except otherwise stated) Sales $350M COGS Year 0 and onward, 40% of Sales SG&A Year 0 and onward, 35% of Sales EBITDA $88M Depreciation SO CAPEX Same as depreciation Tax rate 16.5% Initial Working Capital 10% of Investment (WC) Change of WC Same annual growth rate as Sales Non-Operating Assets $0 Debt $30M Equity $140M Beta 2 Cost of Debt 8% Risk Premium 9% Riskfree Rate 3% Cash and Cash Equivalent $0 Shares outstanding 12M (same before and after investment) The remaining SHL's financial data and the two comparable companies' (ListCo X and Y) are as follows: SHL ListCo X ListCo Y 150 30 67 100 0 41 280 63 60 From Balance Sheet ('M) Assets Long Term Net Debt Net Worth (Book) From Income Statement ('M) Sales EBITDA Net Income (E, Earnings) From Market Data Earning per share (EPS; RMB/share) Price-Earnings Ratio (P/E; times) Shares Outstanding (M) Number of Active Users D/A (Capital Structure) 350 88 73 330 32 23 250 125 86 6.08 n/a 12 0.92 7.0 25 2.87 6.0 30 13,000,000 20% 5,000,000 0% 15,000,000 23%
Step by Step Solution
There are 3 Steps involved in it
Step: 1

Get Instant Access to Expert-Tailored Solutions
See step-by-step solutions with expert insights and AI powered tools for academic success
Step: 2

Step: 3
Ace Your Homework with AI
Get the answers you need in no time with our AI-driven, step-by-step assistance
Get Started
Ouch What You Dont Know About Money And Why It Matters More Than You Think
Authors: Paul Knott
1st Edition
0133527077,0273788752