

Answered step by step
Verified Expert Solution
Question
1 Approved Answer
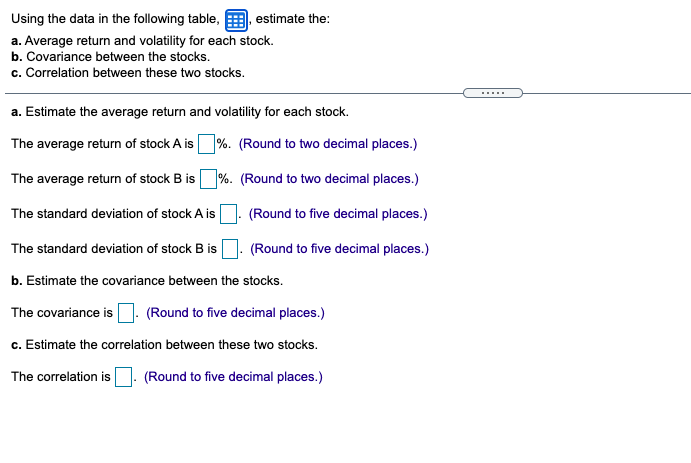
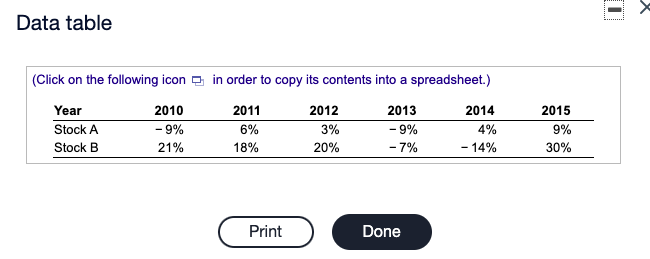
estimate the: Using the data in the following table, a. Average return and volatility for each stock. b. Covariance between the stocks. c. Correlation between
Step by Step Solution
There are 3 Steps involved in it
Step: 1

Get Instant Access to Expert-Tailored Solutions
See step-by-step solutions with expert insights and AI powered tools for academic success
Step: 2

Step: 3
Ace Your Homework with AI
Get the answers you need in no time with our AI-driven, step-by-step assistance
Get Started
Ethics In Finance
Authors: John R. Boatright
3rd Edition
1118615824, 978-1118615829