

Answered step by step
Verified Expert Solution
Question
1 Approved Answer
etween 100 at two lines a Crat around the 1. 3/17/23 Displacement - Time (d-t) Graphs Worksheet 3 This type of graph is based
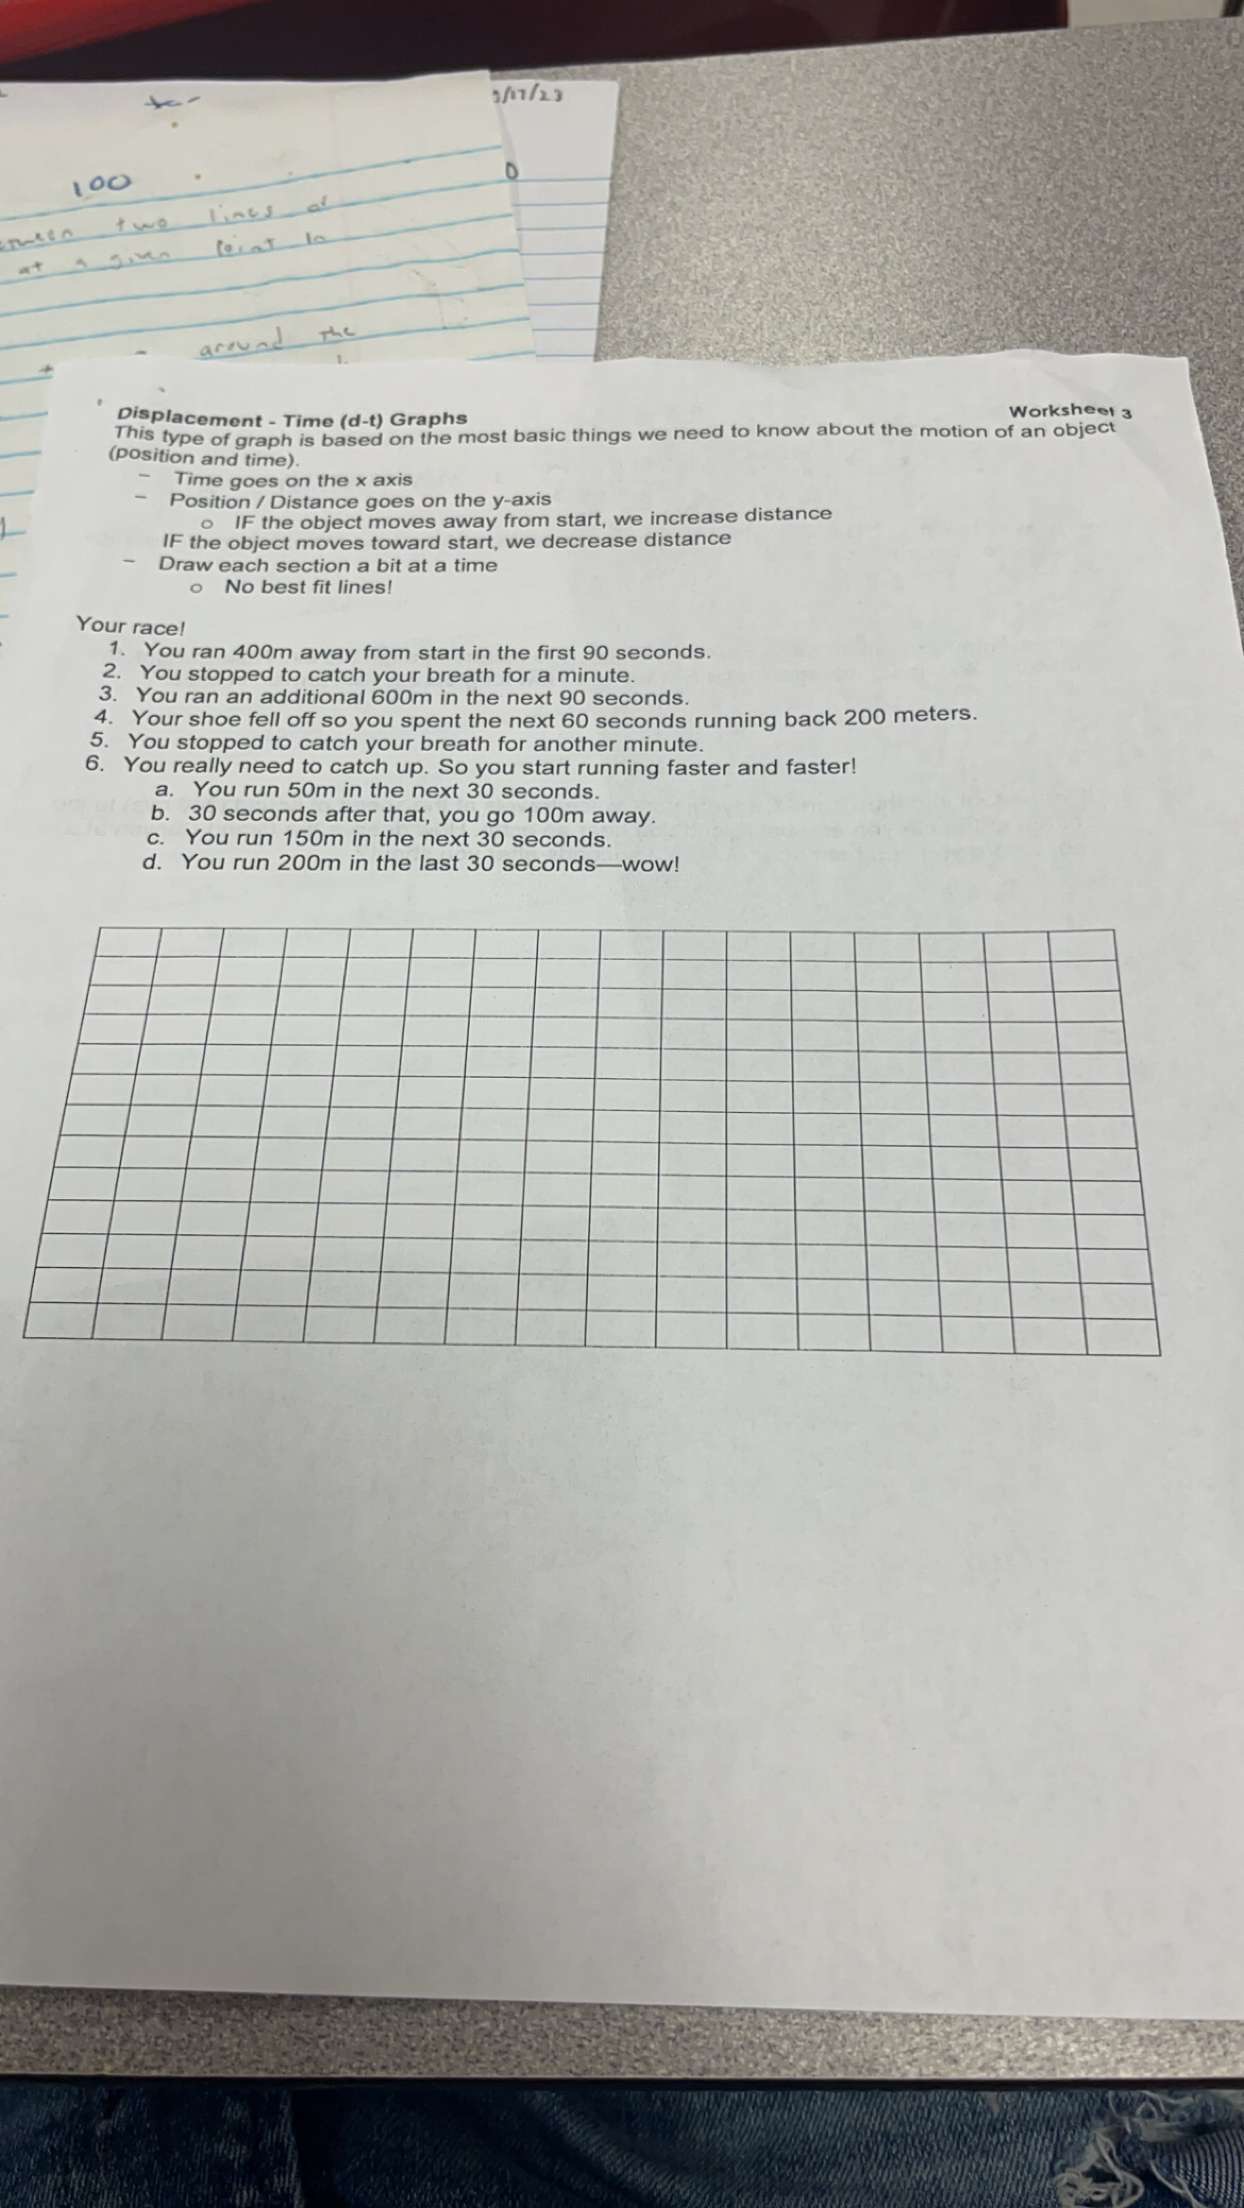
etween 100 at two lines a Crat around the 1. 3/17/23 Displacement - Time (d-t) Graphs Worksheet 3 This type of graph is based on the most basic things we need to know about the motion of an object (position and time). Time goes on the x axis Position / Distance goes on the y-axis o IF the object moves away from start, we increase distance IF the object moves toward start, we decrease distance Draw each section a bit at a time Your race! o No best fit lines! 1. You ran 400m away from start in the first 90 seconds. 2. You stopped to catch your breath for a minute. 3. You ran an additional 600m in the next 90 seconds. 4. Your shoe fell off so you spent the next 60 seconds running back 200 meters. 5. You stopped to catch your breath for another minute. 6. You really need to catch up. So you start running faster and faster! a. You run 50m in the next 30 seconds. b. 30 seconds after that, you go 100m away. c. You run 150m in the next 30 seconds. d. You run 200m in the last 30 seconds-wow!
Step by Step Solution
There are 3 Steps involved in it
Step: 1

Get Instant Access to Expert-Tailored Solutions
See step-by-step solutions with expert insights and AI powered tools for academic success
Step: 2

Step: 3
Ace Your Homework with AI
Get the answers you need in no time with our AI-driven, step-by-step assistance
Get Started
Fundamentals of Heat and Mass Transfer
Authors: Incropera, Dewitt, Bergman, Lavine
6th Edition
978-0470055540, 471457280, 470881453, 470055545, 978-0470881453, 978-0471457282