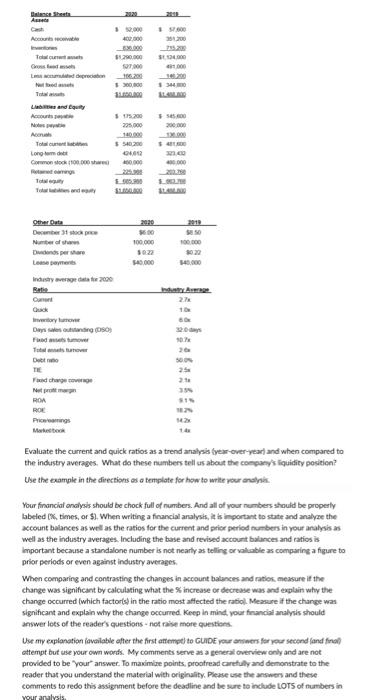
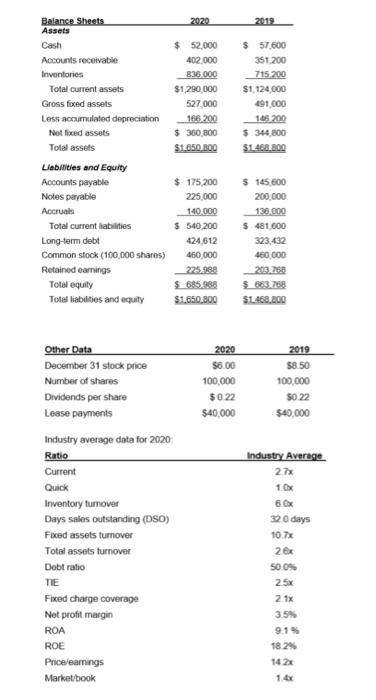
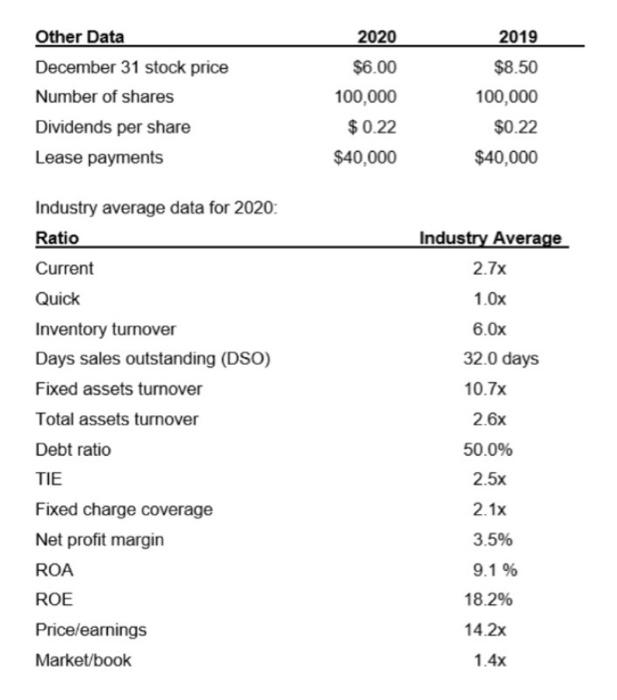
Evaluate the current and euick ratios as a trend analysis fyear-over-yearf and when compared to the industry averages. What do these numbers tell us aboit the conpany's fiquidity position? Whe the exampie in the directions as a template for how to write your analoni. Your financiat onalysis should be chock full of numbers. And all of your nembers should be properly labeled (2x, times, of 51 . When writing a financial aralysis, it is important to state and analyae the account balances as well as the ratios for the current and prior period numbers in your analysis as well as the industry averages. Including the base and revised account balances and ratios is important because a standalone number is not nearly as telling or valuable as comparing a figure to priar periods or even against industry averages. When comparing and contrasting the changes in account balences and ratiok, measure it the change was significant by calculating what the % increase or decrease was and explain why the change occurred (which factorts) in the ratio most affected the ratiol. Measure if the change was significant and explain why the change occurred. Keep in mind, your franclat analysis thould answer lots of the reader's questions - not rase more questions. Use my explanotion iavailable after the first attempt to GUDE yeur anwen for your second (and finat) attempt but use your own words. My comments serve as a seneral overview only and are not provided to be "your" answer. To maximine points, prootread carefuly and demonstrate to the reader that you understand the material with orighality. Plexse use the ansmen and theve comments to redo this assignment before the deadline and te sure to indlude tors of numbers in \begin{tabular}{lrrr} Balance Sheets & 2020 & 2019 \\ \hline Assets & & \\ Cash & $,52,000 & $7,600 \\ Accounts recoivable & 402,000 & 351,200 \\ Invontories & $3,290,000 & & 715,200 \\ Total current assets & $1,124,000 \\ Gross fixed assets & 527,000 & 491,000 \\ Less accurnulated depreciation & 166,200 & 105,200 \\ Not fixed assets & $360,800 & $344,800 \\ Tolal assets & $1,050,800 & $1,468,800 \end{tabular} Liabilities and Equity \begin{tabular}{lrr} Other Data & 2020 & 2019 \\ \hline December 31 stock price & $6.00 & $8.50 \\ Number of shares & 100,000 & 100,000 \\ Dividends per share & $0.22 & $0.22 \\ Lease payments & $40,000 & $40,000 \end{tabular} Industry average data for 2020 - Ratio Industry Average. Current 27x Quick 1.0x Inventory turnover 6.0x Days sales outstanding (DSO) 320 days Fixed assets turnover 10.7x Total assets turnover 2.6x Dobt ratio s0. 0 s. TE 2.5x Fixed charge coverage 2.1x Not profit margin ROA 3.5% ROE 9. 1%m Price/earnings 18.24 Market/book 14.2x 1. 4x \begin{tabular}{lrr} Other Data & 2020 & 2019 \\ \hline December 31 stock price & $6.00 & $8.50 \\ Number of shares & 100,000 & 100,000 \\ Dividends per share & $0.22 & $0.22 \\ Lease payments & $40,000 & $40,000 \end{tabular} Industry average data for 2020 : RatioCurrentQuickInventoryturnoverDayssalesoutstanding(DSO)FixedassetsturnoverTotalassetsturnoverDebtratioTIEFixedchargecoverageNetprofitmarginROAROEPrice/earningsMarket/bookIndustryAver2.7x1.0x6.0x32.0day10.7x2.6x50.0%2.5x2.1x3.5%9.1%18.2%14.2x1.4x Evaluate the current and euick ratios as a trend analysis fyear-over-yearf and when compared to the industry averages. What do these numbers tell us aboit the conpany's fiquidity position? Whe the exampie in the directions as a template for how to write your analoni. Your financiat onalysis should be chock full of numbers. And all of your nembers should be properly labeled (2x, times, of 51 . When writing a financial aralysis, it is important to state and analyae the account balances as well as the ratios for the current and prior period numbers in your analysis as well as the industry averages. Including the base and revised account balances and ratios is important because a standalone number is not nearly as telling or valuable as comparing a figure to priar periods or even against industry averages. When comparing and contrasting the changes in account balences and ratiok, measure it the change was significant by calculating what the % increase or decrease was and explain why the change occurred (which factorts) in the ratio most affected the ratiol. Measure if the change was significant and explain why the change occurred. Keep in mind, your franclat analysis thould answer lots of the reader's questions - not rase more questions. Use my explanotion iavailable after the first attempt to GUDE yeur anwen for your second (and finat) attempt but use your own words. My comments serve as a seneral overview only and are not provided to be "your" answer. To maximine points, prootread carefuly and demonstrate to the reader that you understand the material with orighality. Plexse use the ansmen and theve comments to redo this assignment before the deadline and te sure to indlude tors of numbers in \begin{tabular}{lrrr} Balance Sheets & 2020 & 2019 \\ \hline Assets & & \\ Cash & $,52,000 & $7,600 \\ Accounts recoivable & 402,000 & 351,200 \\ Invontories & $3,290,000 & & 715,200 \\ Total current assets & $1,124,000 \\ Gross fixed assets & 527,000 & 491,000 \\ Less accurnulated depreciation & 166,200 & 105,200 \\ Not fixed assets & $360,800 & $344,800 \\ Tolal assets & $1,050,800 & $1,468,800 \end{tabular} Liabilities and Equity \begin{tabular}{lrr} Other Data & 2020 & 2019 \\ \hline December 31 stock price & $6.00 & $8.50 \\ Number of shares & 100,000 & 100,000 \\ Dividends per share & $0.22 & $0.22 \\ Lease payments & $40,000 & $40,000 \end{tabular} Industry average data for 2020 - Ratio Industry Average. Current 27x Quick 1.0x Inventory turnover 6.0x Days sales outstanding (DSO) 320 days Fixed assets turnover 10.7x Total assets turnover 2.6x Dobt ratio s0. 0 s. TE 2.5x Fixed charge coverage 2.1x Not profit margin ROA 3.5% ROE 9. 1%m Price/earnings 18.24 Market/book 14.2x 1. 4x \begin{tabular}{lrr} Other Data & 2020 & 2019 \\ \hline December 31 stock price & $6.00 & $8.50 \\ Number of shares & 100,000 & 100,000 \\ Dividends per share & $0.22 & $0.22 \\ Lease payments & $40,000 & $40,000 \end{tabular} Industry average data for 2020 : RatioCurrentQuickInventoryturnoverDayssalesoutstanding(DSO)FixedassetsturnoverTotalassetsturnoverDebtratioTIEFixedchargecoverageNetprofitmarginROAROEPrice/earningsMarket/bookIndustryAver2.7x1.0x6.0x32.0day10.7x2.6x50.0%2.5x2.1x3.5%9.1%18.2%14.2x1.4x


