Evaluate the current financial health of the company Beyond Meat by presenting your findings of relevant financial information based on a subset of the following:
Ratios: 1) liquidity 2) profitability, 3) leverage, 4) efficiency, 5) operating, and 6) market value and investment ratios.
Also, using trend analysis, and/or common size analysis, and/or longitudinal analysis based on CAGR (Compound Annual Growth Rate see CAGR in Investopedia.com ) to either reinforce staying with the companys status quo or to suggest changes in strategy in light of the results.
EXAMPLE:
If applicable, also include competitive financial analysis and/or other relevant financial findings by investigating all quantitative information provided.
For each of your calculations or observations note whether a trend is up, down or flat and note the strategic impact of each finding.
A concluding summary statement should address the strategic implications arising from your analysis of the financial health of the company.
*USE THE DATA BELOW TO CREATE FINANICAL ANLYSIS FOR BEYOND MEAT
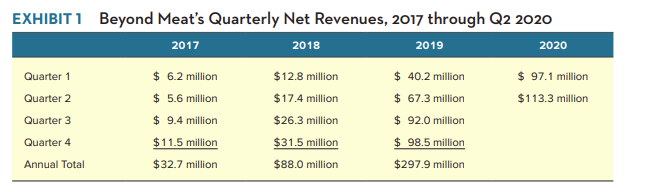
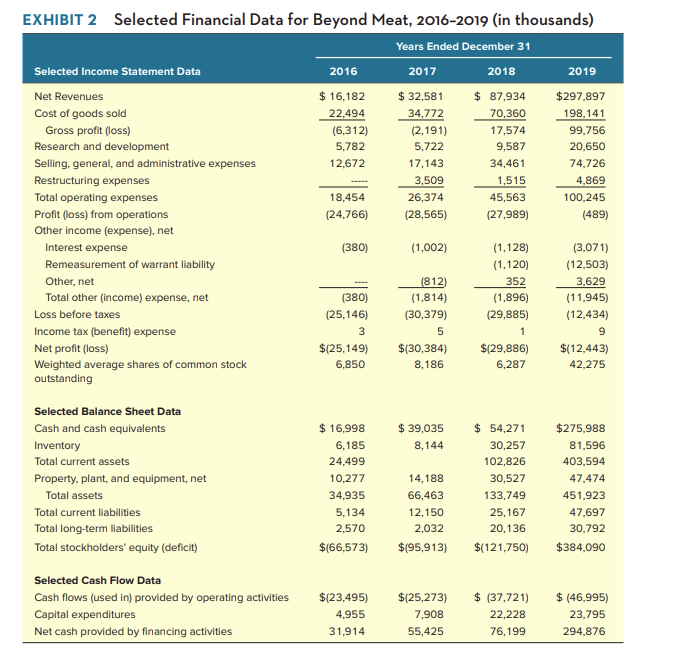
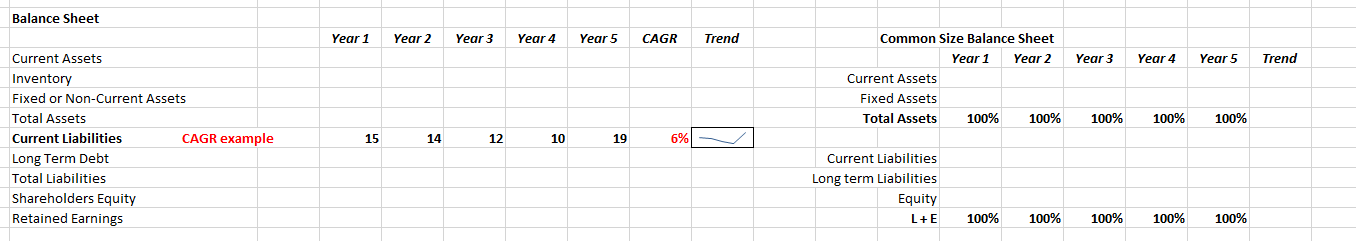
Balance Sheet Year 1 Year 2 Year 3 Year 4 Year 5 CAGR Trend Year 3 Year 4 Year 5 Trend Common Size Balance Sheet Year 1 Year 2 Current Assets Fixed Assets Total Assets 100% 100% 100% 100% 100% Current Assets Inventory Fixed or Non-Current Assets Total Assets Current Liabilities CAGR example Long Term Debt Total Liabilities Shareholders Equity Retained Earnings 15 14 12 10 19 6% 6 Current Liabilities Long term Liabilities Equity L+E 100% 100% 100% 100% 100% EXHIBIT 1 2019 Quarter 1 Quarter 2 Quarter 3 Beyond Meat's Quarterly Net Revenues, 2017 through Q2 2020 2017 2018 2020 $ 6.2 million $12.8 million $ 40.2 million $ 97.1 million $ 5.6 million $17.4 million $ 67.3 million $113.3 million $ 9.4 million $26.3 million $ 92.0 million $11.5 million $31.5 million $ 98.5 million $32.7 million $88.0 million $297.9 million Quarter 4 Annual Total EXHIBIT 2 Selected Financial Data for Beyond Meat, 2016-2019 (in thousands) Years Ended December 31 Selected Income Statement Data 2016 2017 2018 2019 Net Revenues $ 16,182 $ 32,581 $ 87,934 $297,897 Cost of goods sold 22,494 34,772 70,360 198,141 Gross profit (loss) (6,312) (2,191) 17,574 99,756 Research and development 5.782 5,722 9,587 20,650 Selling, general, and administrative expenses 12,672 17,143 34,461 74,726 Restructuring expenses 3,509 1,515 4,869 Total operating expenses 18,454 26,374 45,563 100,245 Profit (loss) from operations (24,766) (28,565) (27,989) (489) Other income (expense), net Interest expense (380) (1.002) (1,128) (3,071) Remeasurement of warrant liability (1,120) (12,503) Other, net (812) 352 3,629 Total other (income) expense, net (380) (1,814) (1,896) (11,945) Loss before taxes (25,146) (30,379) (29,885) (12,434) Income tax (benefit) expense 3 5 1 9 Net profit (loss) $(25,149) $(30,384) $129,886) $(12,443) Weighted average shares of common stock 6,850 8,186 6,287 42,275 outstanding $ 39,035 8,144 Selected Balance Sheet Data Cash and cash equivalents Inventory Total current assets Property, plant, and equipment, net Total assets Total current liabilities Total long-term liabilities Total stockholders' equity (deficit) $ 16,998 6,185 24,499 10,277 34,935 5,134 2,570 $(66,573) 14,188 66,463 12,150 2,032 $(95,913) $ 54,271 30,257 102,826 30,527 133,749 25,167 20,136 $(121,750) $275,988 81,596 403,594 47.474 451,923 47,697 30,792 $384,090 Selected Cash Flow Data Cash flows (used in) provided by operating activities Capital expenditures Net cash provided by financing activities $(23,495) 4,955 31,914 $(25,273) 7,908 55,425 $ (37,721) 22,228 76,199 $ (46,995) 23,795 294,876 Balance Sheet Year 1 Year 2 Year 3 Year 4 Year 5 CAGR Trend Year 3 Year 4 Year 5 Trend Common Size Balance Sheet Year 1 Year 2 Current Assets Fixed Assets Total Assets 100% 100% 100% 100% 100% Current Assets Inventory Fixed or Non-Current Assets Total Assets Current Liabilities CAGR example Long Term Debt Total Liabilities Shareholders Equity Retained Earnings 15 14 12 10 19 6% 6 Current Liabilities Long term Liabilities Equity L+E 100% 100% 100% 100% 100% EXHIBIT 1 2019 Quarter 1 Quarter 2 Quarter 3 Beyond Meat's Quarterly Net Revenues, 2017 through Q2 2020 2017 2018 2020 $ 6.2 million $12.8 million $ 40.2 million $ 97.1 million $ 5.6 million $17.4 million $ 67.3 million $113.3 million $ 9.4 million $26.3 million $ 92.0 million $11.5 million $31.5 million $ 98.5 million $32.7 million $88.0 million $297.9 million Quarter 4 Annual Total EXHIBIT 2 Selected Financial Data for Beyond Meat, 2016-2019 (in thousands) Years Ended December 31 Selected Income Statement Data 2016 2017 2018 2019 Net Revenues $ 16,182 $ 32,581 $ 87,934 $297,897 Cost of goods sold 22,494 34,772 70,360 198,141 Gross profit (loss) (6,312) (2,191) 17,574 99,756 Research and development 5.782 5,722 9,587 20,650 Selling, general, and administrative expenses 12,672 17,143 34,461 74,726 Restructuring expenses 3,509 1,515 4,869 Total operating expenses 18,454 26,374 45,563 100,245 Profit (loss) from operations (24,766) (28,565) (27,989) (489) Other income (expense), net Interest expense (380) (1.002) (1,128) (3,071) Remeasurement of warrant liability (1,120) (12,503) Other, net (812) 352 3,629 Total other (income) expense, net (380) (1,814) (1,896) (11,945) Loss before taxes (25,146) (30,379) (29,885) (12,434) Income tax (benefit) expense 3 5 1 9 Net profit (loss) $(25,149) $(30,384) $129,886) $(12,443) Weighted average shares of common stock 6,850 8,186 6,287 42,275 outstanding $ 39,035 8,144 Selected Balance Sheet Data Cash and cash equivalents Inventory Total current assets Property, plant, and equipment, net Total assets Total current liabilities Total long-term liabilities Total stockholders' equity (deficit) $ 16,998 6,185 24,499 10,277 34,935 5,134 2,570 $(66,573) 14,188 66,463 12,150 2,032 $(95,913) $ 54,271 30,257 102,826 30,527 133,749 25,167 20,136 $(121,750) $275,988 81,596 403,594 47.474 451,923 47,697 30,792 $384,090 Selected Cash Flow Data Cash flows (used in) provided by operating activities Capital expenditures Net cash provided by financing activities $(23,495) 4,955 31,914 $(25,273) 7,908 55,425 $ (37,721) 22,228 76,199 $ (46,995) 23,795 294,876