Question
Every firm in the list of possible cases for the capstone has a five-year period of analysis. Financial data comes from the Form 10 documents
Every firm in the list of possible cases for the capstone has a five-year period of analysis. Financial data comes from the Form 10 documents each firm submits to the U.S. Securities Exchange Commision. Form 10 includes Balance Sheets and Income Statements we collect for the Five-year Financials.
For most firms, there are five years of financial information. However, it may be there are only 4 or 3 years available. Just collect all what you can get in Excel.
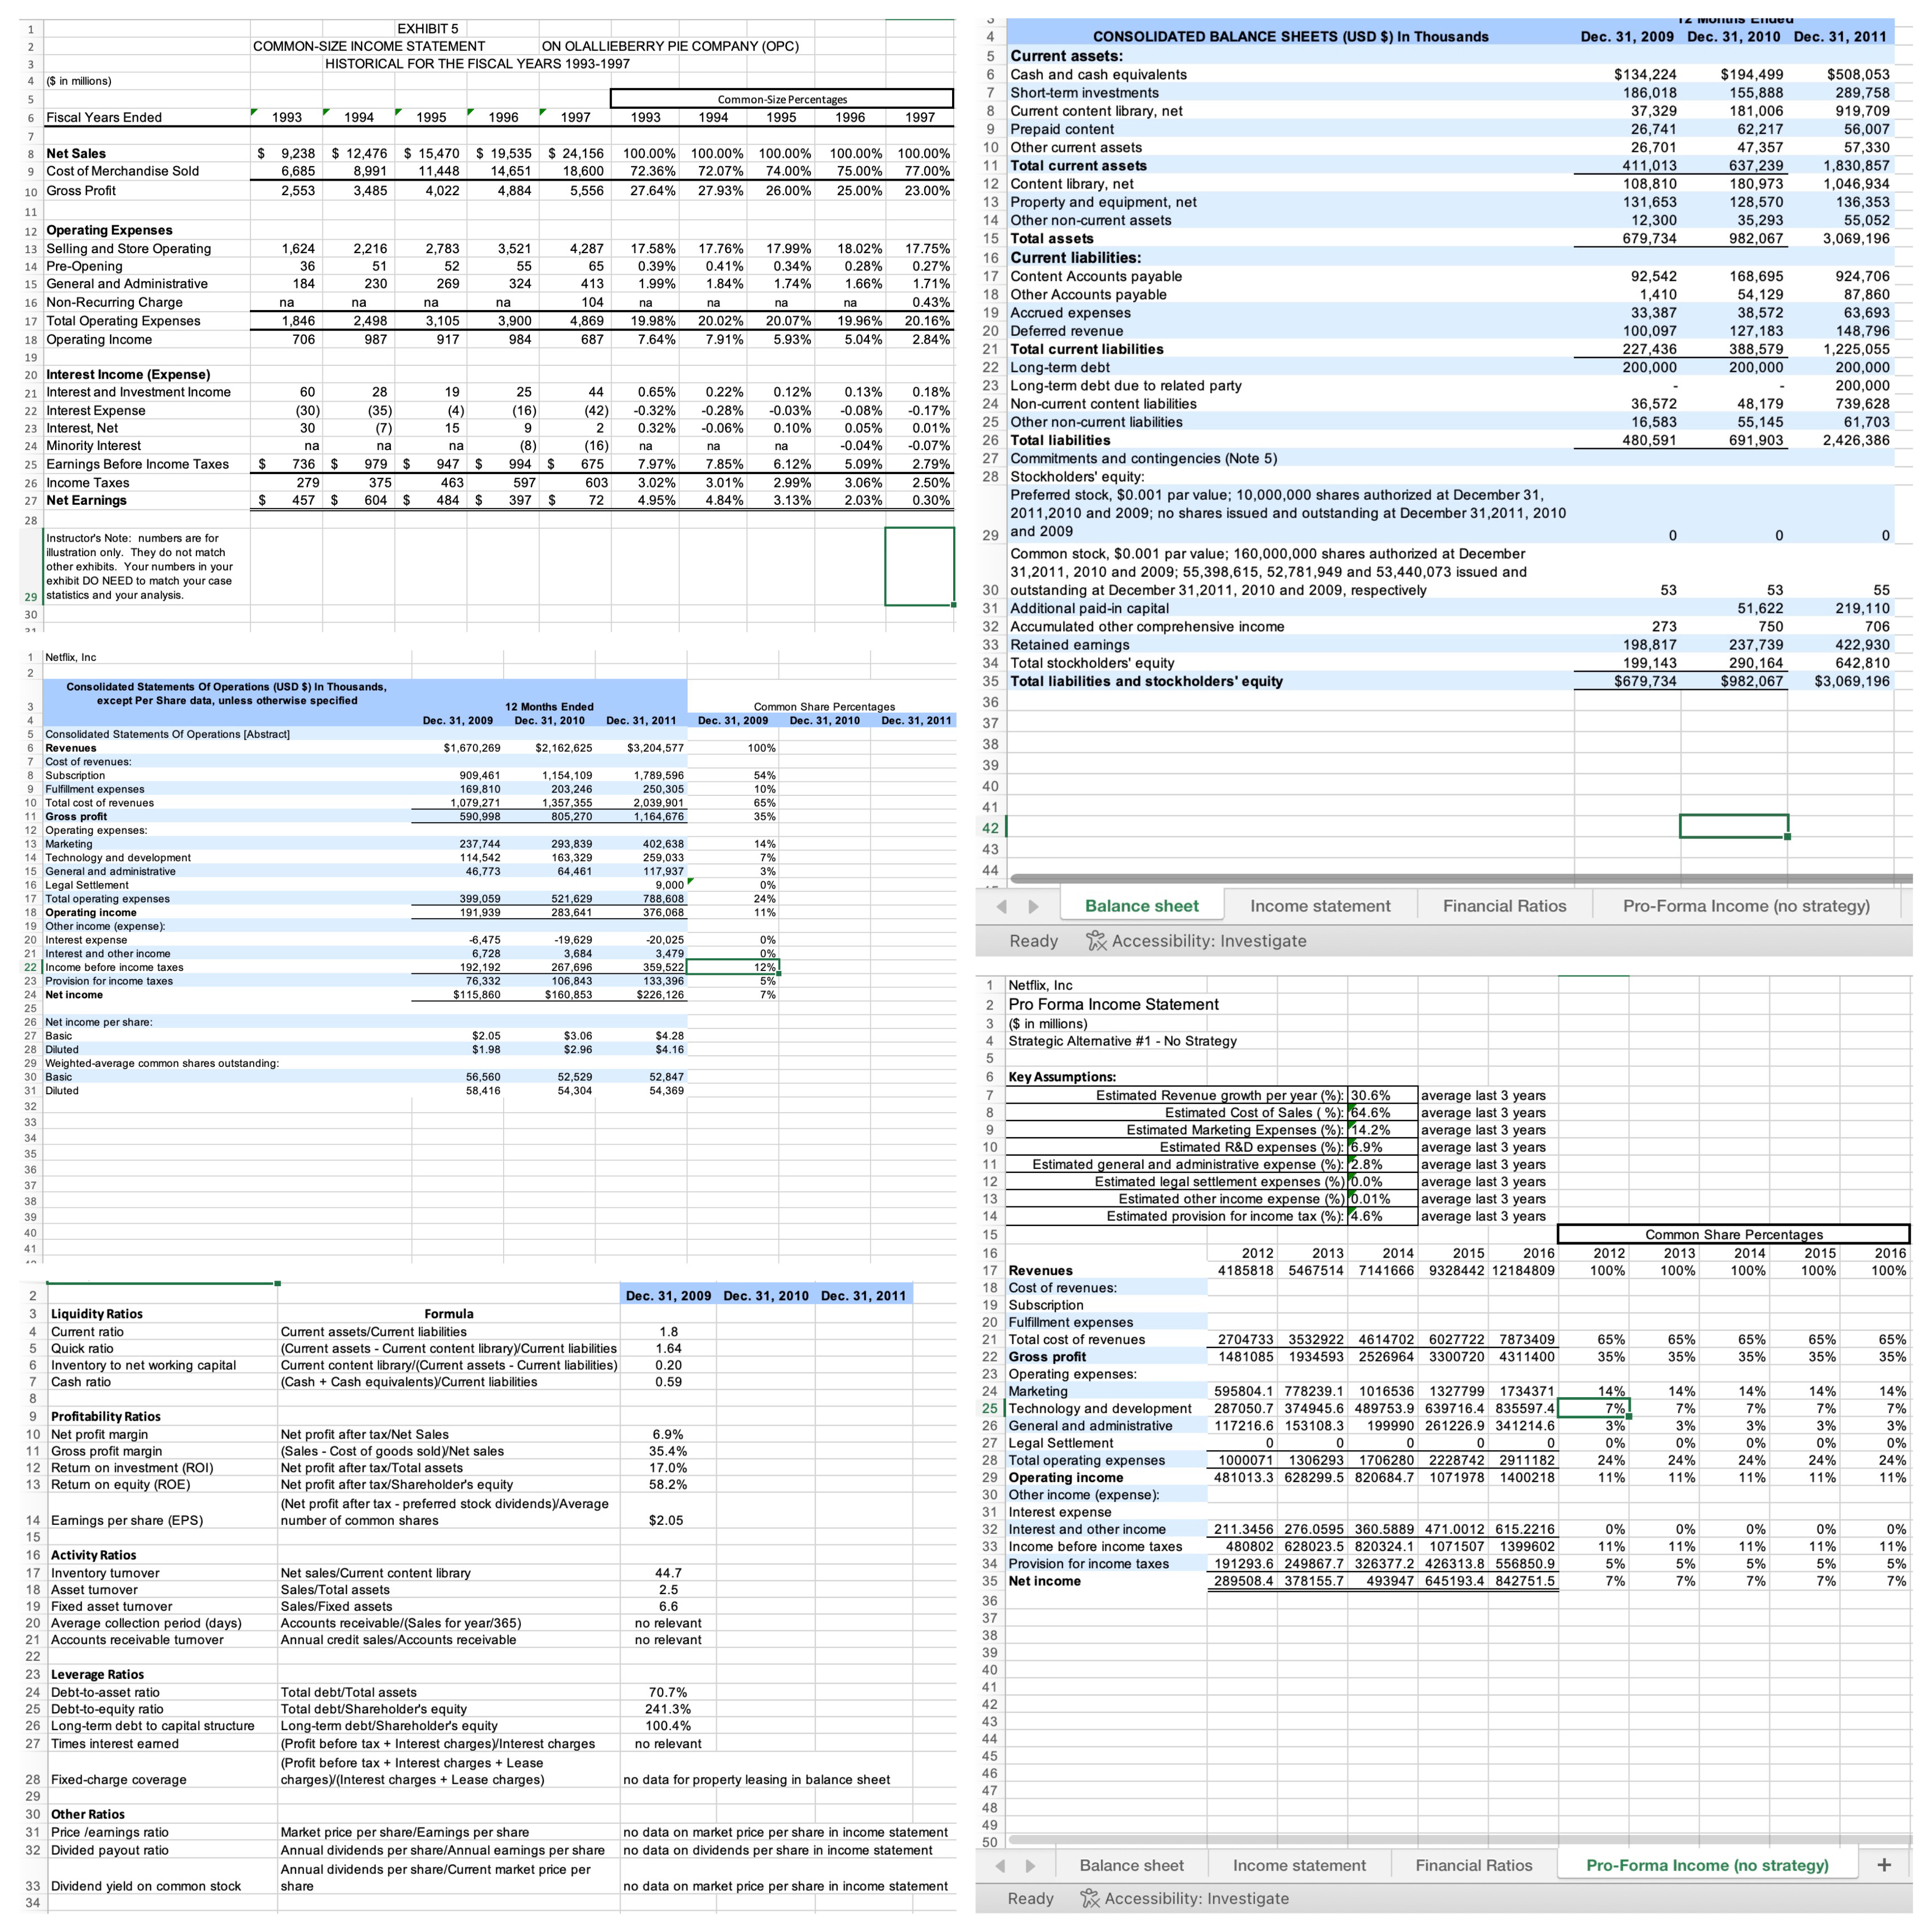
The 5-Y financials Excel workbook includes six sheets: Balance Sheet, Income Statement with Common Size Percentages, and Financial Ratios you must complete in BUS485A. This Excel also includes three Pro-Forma Income sheets for three strategies that will be done in BUS485B.
Excel workbooks with the 5-Y financials for some firms are already available for you to customize in Course Resources/5Y Financials.
What is the Common Size Percentages?
Common size percentages are metrics to compare firm performance over the five years of analysis. All items in the income statement are presented as percentages of Sales or Revenue. For instance, when total costs are expressed as a percentage of sales, and it goes up from 43% to 49%, we could conclude costs have increased over time and we should research why costs went up. Is this because of internal or external factors?
What do you have to do?
After having chosen your firm of study, verify if there are already 5-Year financials for that firm in Course Resources. If it is, verify the data is correct with the Balance Sheet and Income Statement data in SEC-Form10 for the years of your analysis.
If there is no 5-Year financials Excel in Course Resources, you must create one using Form 10 for your period of analysis. Collect Balance Sheet and Income Statement annual data. Depending on your Excel skills, you should request help from your instructor to create formulas and the sheets for common size percentages, financial ratios, and Pro-Forma.
Use the template for Exhibit 5 - Common Size Percentages
Use the TemplateSA-EXH 5-CommonSize.xlsx to guide your work. This template shows the income statement for five years, and the common size percentages calculated to the right. Review how formulas are created for the 1993 common size percentage column, G8 to G27. These formulas were copied to the other years to the right. Because, when you use formulas in Excel, you just type one time, and then you copy it to generate the entire table! You must do the same in your 5Y-financials, sheet Income Statement.

1 2 3 4 ($ in millions) 5 6 Fiscal Years Ended 7 8 Net Sales 9 Cost of Merchandise Sold 10 Gross Profit 11 12 Operating Expenses 13 Selling and Store Operating 14 Pre-Opening 15 General and Administrative 16 Non-Recurring Charge 17 Total Operating Expenses 18 Operating Income 19 20 Interest Income (Expense) 21 Interest and Investment Income 22 Interest Expense 23 Interest, Net 24 Minority Interest 25 Earnings Before Income Taxes 26 Income Taxes 27 Net Earnings 28 29 statistics and your analysis. 30 21 Instructor's Note: numbers are for illustration only. They do not match other exhibits. Your numbers in your exhibit DO NEED to match your case 1 2 Netflix, Inc Revenues Cost of revenues: Subscription Fulfillment expenses 14 Technology and development 15 General and administrative 16 Legal Settlement 17 Total operating expenses 2 3 Liquidity Ratios 4 Current ratio 5 Quick ratio 6 Inventory to net working capital Cash ratio 7 8 9 Profitability Ratios 10 Net profit margin 11 Gross profit margin 12 Return on investment (ROI) 13 Return on equity (ROE) 3 4 5 Consolidated Statements Of Operations [Abstract] 6 7 8 9 10 Total cost of revenues 11 Gross profit 12 Operating expenses: 13 Marketing 14 Eamings per share (EPS) 15 16 Activity Ratios 17 Inventory turnover 18 Asset turnover 19 Fixed asset turnover 20 Average collection period (days) 21 Accounts receivable turnover 22 EXHIBIT 5 COMMON-SIZE INCOME STATEMENT 18 Operating income 19 Other income (expense): 20 Interest expense 21 Interest and other income 22 Income before income taxes 23 Provision for income taxes 24 Net income 25 26 Net income per share: 27 Basic 28 Diluted 29 Weighted-average common shares outstanding: 30 Basic 31 Diluted 32 33 34 35 36 37 38 39 40 41 23 Leverage Ratios 24 Debt-to-asset ratio 25 Debt-to-equity ratio 26 Long-term debt to capital structure 27 Times interest earned 28 Fixed-charge coverage 29 30 Other Ratios 31 Price learnings ratio 32 Divided payout ratio $9,238 6,685 2,553 $ 33 Dividend yield on common stock 34 1993 $ 1,624 36 184 na 1,846 706 60 (30) 30 Consolidated Statements Of Operations (USD $) In Thousands, except Per Share data, unless otherwise specified na 736 HISTORICAL FOR THE FISCAL YEARS 1993-1997 $ 12,476 8,991 3,485 $ 1994 279 457 $ 2,216 51 230 na 2,498 987 28 (35) (7) na 979 375 604 $ 1995 $ 2,783 52 269 na 3,105 917 19 (4) 15 na 947 $ 15,470 $ 19,535 $ 24,156 100.00% 100.00% 100.00% 100.00% 100.00% 11,448 14,651 18,600 72.36% 72.07% 74.00% 75.00% 77.00% 4,022 4,884 5,556 27.64% 27.93% 26.00% 25.00% 23.00% 463 484 $ 1996 $ Dec. 31, 2009 3,521 55 324 na 3,900 984 $1,670,269 909,461 169,810 1,079,271 590,998 237,744 114,542 46,773 399,059 191,939 -6,475 6,728 192,192 76,332 $115,860 Total debt/Total assets Total debt/Shareholder's equity $2.05 $1.98 56,560 58,416 ON OLALLIEBERRY PIE COMPANY (OPC) 25 (16) 9 (8) $ 994 597 397 $ Net profit after tax/Net Sales (Sales - Cost of goods sold)/Net sales Net profit after tax/Total assets Net profit after tax/Shareholder's equity 1997 Net sales/Current content library Sales/Total assets Sales/Fixed assets Accounts receivable/(Sales for year/365) Annual credit sales/Accounts receivable 12 Months Ended Dec. 31, 2010 44 (42) 2 (16) 675 603 72 4,287 17.58% 17.76% 65 0.39% 0.41% 413 1.99% 1.84% 104 4,869 687 na 20.02% 7.91% $2,162,625 1,154,109 203,246 1,357,355 805,270 293,839 163,329 64,461 521,629 283,641 -19,629 3,684 267,696 106,843 $160,853 $3.06 $2.96 Formula Current assets/Current liabilities (Current assets - Current content library)/Current liabilities Current content library/(Current assets - Current liabilities) (Cash + Cash equivalents)/Current liabilities 52,529 54,304 (Net profit after tax-preferred stock dividends)/Average number of common shares 1993 Long-term debt/Shareholder's equity (Profit before tax + Interest charges)/Interest charges (Profit before tax + Interest charges + Lease charges)/(Interest charges + Lease charges) Market price per share/Eamings per share Annual dividends per share/Annual earings per share Annual dividends per share/Current market price per share na 19.98% 7.64% Dec. 31, 2011 $3,204,577 na 7.97% 3.02% 4.95% 0.65% 0.22% -0.32% -0.28% 0.32% -0.06% na 1,789,596 250,305 2,039,901 1,164,676 402,638 259,033 117,937 9,000 788,608 376,068 -20,025 3,479 359,522 133,396 $226,126 $4.28 $4.16 52,847 54,369 1.8 1.64 0.20 0.59 1994 6.9% 35.4% 17.0% 58.2% Common-Size Percentages $2.05 44.7 2.5 6.6 no relevant no relevant 1995 7.85% 3.01% 4.84% 70.7% 241.3% 100.4% no relevant Dec. 31, 2009 17.99% 18.02% 17.75% 0.34% 0.28% 0.27% 1.74% 1.66% 1.71% 0.43% 19.96% 20.16% 5.04% 2.84% na na 20.07% 5.93% 0.12% -0.03% 0.10% na 6.12% 2.99% 3.13% 100% 1996 Common Share Percentages Dec. 31, 2010 54% 10% 65% 35% 14% 7% 3% 0% 24% 11% 0% 0% 12% 5% 7% Dec. 31, 2009 Dec. 31, 2010 Dec. 31, 2011 1997 0.13% 0.18% -0.08% -0.17% 0.05% 0.01% -0.04% -0.07% 2.79% 2.50% 0.30% 5.09% 3.06% 2.03% Dec. 31, 2011 no data for property leasing in balance sheet no data on market price per share in income statement no data on dividends per share in income statement no data on market price per share in income statement J 4 5 6 7 Short-term investments 8 9 10 Other current assets 11 Total current assets 12 Content library, net 13 Property and equipment, net 14 Other non-current assets 15 Total assets Current assets: Cash and cash equivalents CONSOLIDATED BALANCE SHEETS (USD $) In Thousands Current content library, net Prepaid content 16 Current liabilities: 17 Content Accounts payable 18 Other Accounts payable 19 Accrued expenses 20 Deferred revenue 21 Total current liabilities 22 Long-term debt 23 Long-term debt due to related party 24 Non-current content liabilities 25 Other non-current liabilities 26 Total liabilities 27 Commitments and contingencies (Note 5) 28 Stockholders' equity: Preferred stock, $0.001 par value; 10,000,000 shares authorized at December 31, 2011,2010 and 2009; no shares issued and outstanding at December 31, 2011, 2010 29 and 2009 Common stock, $0.001 par value; 160,000,000 shares authorized at December 31,2011, 2010 and 2009; 55,398,615, 52,781,949 and 53,440,073 issued and 30 outstanding at December 31,2011, 2010 and 2009, respectively 31 Additional paid-in capital 32 Accumulated other comprehensive income 33 Retained earnings 34 Total stockholders' equity 35 Total liabilities and stockholders' equity 36 37 38 39 40 41 42 43 44 Ready 36 37 38 39 40 41 42 43 44 45 46 47 48 49 50 Balance sheet 1 Netflix, Inc 2 Pro Forma Income Statement 3 ($ in millions) 4 Strategic Alternative #1 - No Strategy 5 6 7 8 9 10 11 12 13 14 15 16 17 Revenues 18 Cost of revenues: 19 Subscription 20 Fulfillment expenses 21 Total cost of revenues 22 Gross profit 23 Operating expenses: 24 Marketing 25 Technology and development 26 General and administrative Accessibility: Investigate Key Assumptions: 27 Legal Settlement 28 Total operating expenses Ready Estimated Revenue growth per year (%): 30.6% Estimated Cost of Sales (%): 64.6% Estimated Marketing Expenses (%): 14.2% Estimated R&D expenses (%): 6.9% Estimated general and administrative expense (%): 2.8% Estimated legal settlement expenses (%) 0.0% Estimated other income expense (%) 0.01% Estimated provision for income tax (%): 4.6% 29 Operating income 30 Other income (expense): 31 Interest expense 32 Interest and other income 33 Income before income taxes 34 Provision for income taxes 35 Net income Income statement Financial Ratios 0 average last 3 years average last 3 years 2012 2013 2014 2015 2016 4185818 5467514 7141666 9328442 12184809 0 average last 3 years average last 3 years 2704733 3532922 4614702 6027722 7873409 1481085 1934593 2526964 3300720 4311400 average last 3 years average last 3 years average last 3 years average last 3 years 595804.1 778239.1 1016536 1327799 1734371 287050.7 374945.6 489753.9 639716.4 835597.4 117216.6 153108.3 199990 261226.9 341214.6 0 0 1000071 1306293 1706280 2228742 2911182 481013.3 628299.5 820684.7 1071978 1400218 Balance sheet Income statement Accessibility: Investigate 211.3456 276.0595 360.5889 471.0012 615.2216 480802 628023.5 820324.1 1071507 1399602 191293.6 249867.7 326377.2 426313.8 556850.9 289508.4 378155.7 493947 645193.4 842751.5 0 Financial Ratios 12 MOTIUIS ENT Dec. 31, 2009 Dec. 31, 2010 Dec. 31, 2011 $134,224 186,018 37,329 26,741 26,701 411,013 108,810 131,653 12,300 679,734 92,542 1,410 33,387 100,097 227,436 200,000 36,572 16,583 480,591 273 198,817 199,143 $679,734 2012 100% 65% 35% 14% 7% 3% 0% 0 24% 11% 53 0% 11% 5% 7% Pro-Forma Income (no strategy) 65% 35% $194,499 155,888 181,006 62,217 47,357 637,239 180,973 128,570 35,293 982,067 14% 7% 3% 0% 24% 11% 168,695 54,129 38,572 127,183 388,579 200,000 0% 11% 5% 7% 48,179 55,145 691,903 Common Share Percentages 2013 100% 2014 100% 0 53 55 51,622 219,110 750 706 237,739 422,930 290,164 642,810 $982,067 $3,069,196 65% 35% $508,053 289,758 919,709 56,007 57,330 1,830,857 1,046,934 136,353 55,052 3,069,196 14% 7% 3% 0% 24% 11% 924,706 87,860 63,693 148,796 1,225,055 200,000 200,000 739,628 61,703 2,426,386 0% 11% 5% 7% 2015 100% 65% 35% 14% 7% 3% 0% 24% 11% 0% 11% 5% 7% 0 Pro-Forma Income (no strategy) 2016 100% 65% 35% 14% 7% 3% 0% 24% 11% 0% 11% 5% 7% +
Step by Step Solution
There are 3 Steps involved in it
Step: 1
Common size percentages are a useful financial analysis tool that allows for the comparison of vario...
Get Instant Access to Expert-Tailored Solutions
See step-by-step solutions with expert insights and AI powered tools for academic success
Step: 2

Step: 3

Ace Your Homework with AI
Get the answers you need in no time with our AI-driven, step-by-step assistance
Get Started


