Answered step by step
Verified Expert Solution
Question
1 Approved Answer
Ex. Compute the covariance and correlation among stocks A and B from the following joint probability distribution of their rates of returns. P ra


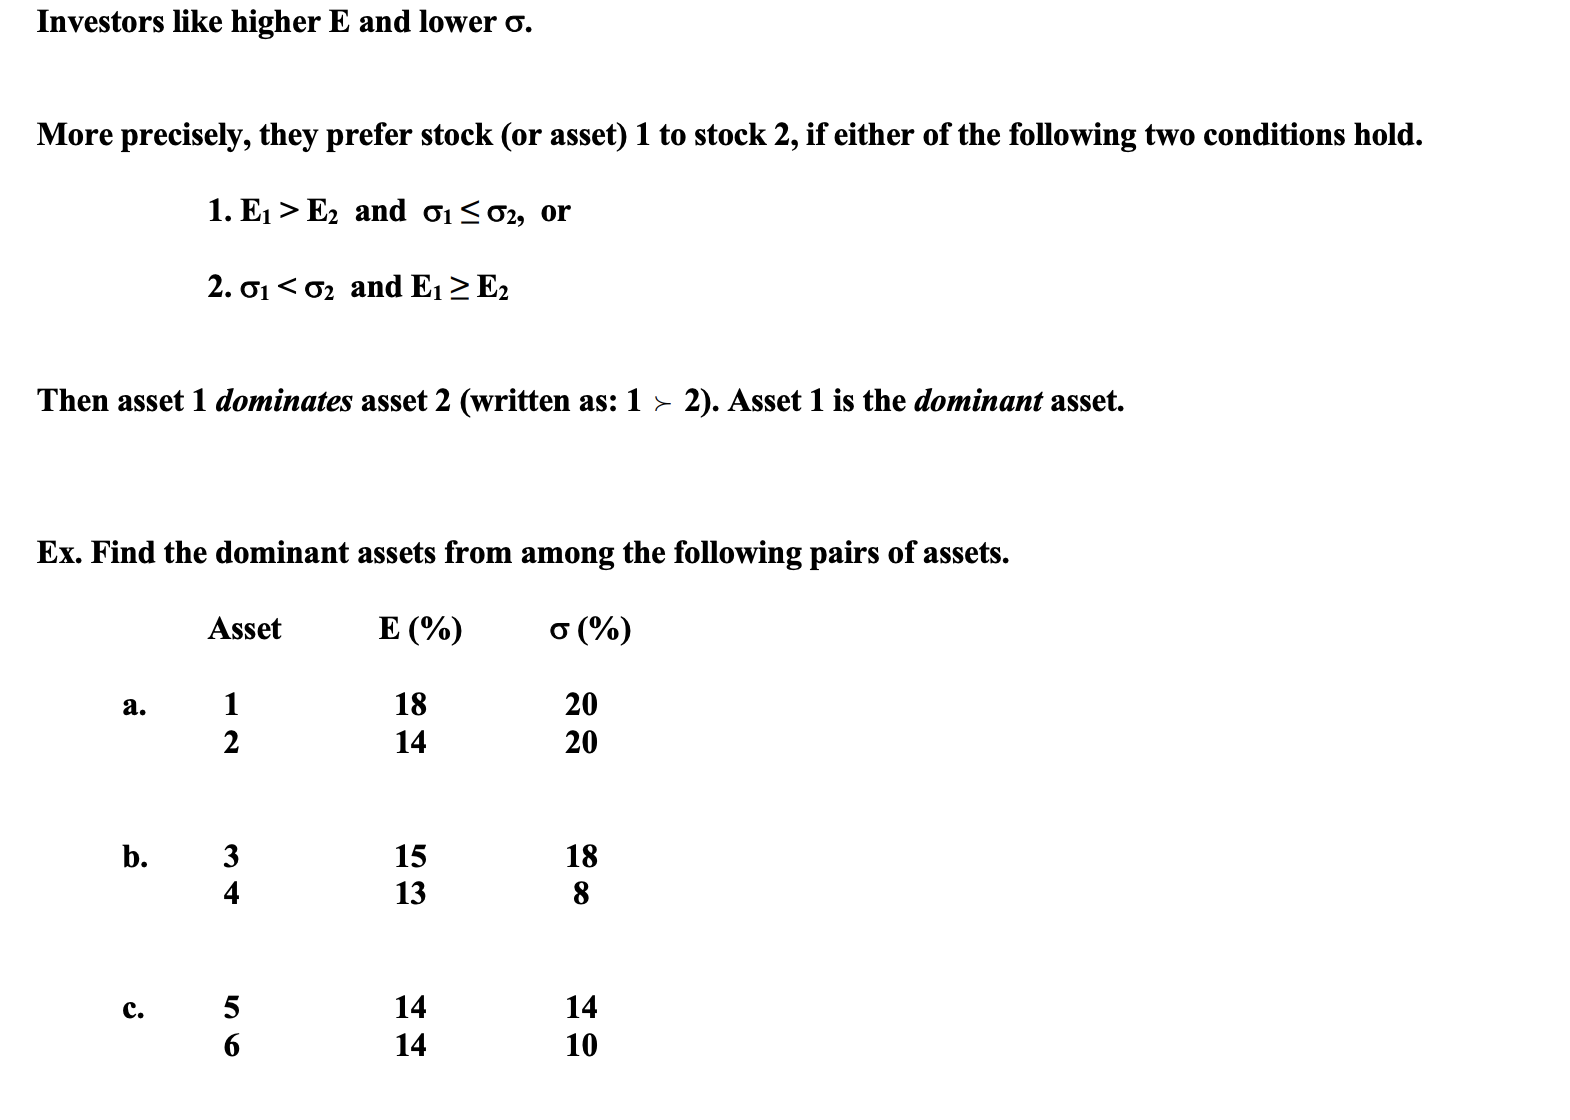
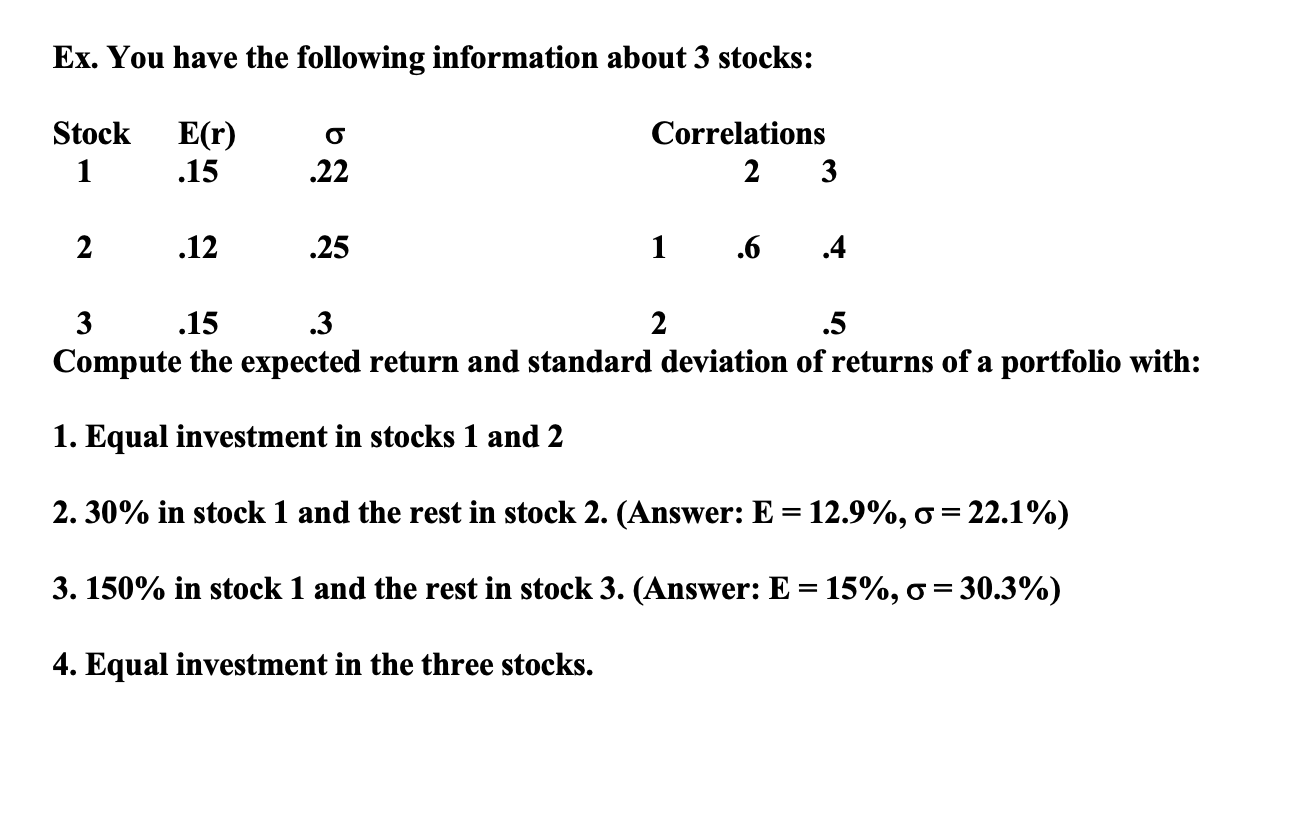
Ex. Compute the covariance and correlation among stocks A and B from the following joint probability distribution of their rates of returns. P ra (%) rB (%) .5 18 14 .3 -15 35 .2 10 -8 Investors like higher E and lower . More precisely, they prefer stock (or asset) 1 to stock 2, if either of the following two conditions hold. 1. E1 E2 and 01 02, or 2. 0102 and E1 > E2 Then asset 1 dominates asset 2 (written as: 1> 2). Asset 1 is the dominant asset. Ex. Find the dominant assets from among the following pairs of assets. Asset E (%) (%) a. 18 2 14 220 b. C. 3 34 56 15 53 13 14 14 18 88 14 10 == Ex. You have the following information about 3 stocks: Stock E(r) 1 .15 .22 2 .12 .25 3 .15 .3 Correlations 2 3 1.6 .4 2 .5 Compute the expected return and standard deviation of returns of a portfolio with: 1. Equal investment in stocks 1 and 2 2. 30% in stock 1 and the rest in stock 2. (Answer: E = 12.9%, = 22.1%) 3. 150% in stock 1 and the rest in stock 3. (Answer: E = 15%, = 30.3%) 4. Equal investment in the three stocks.
Step by Step Solution
There are 3 Steps involved in it
Step: 1

Get Instant Access to Expert-Tailored Solutions
See step-by-step solutions with expert insights and AI powered tools for academic success
Step: 2

Step: 3

Ace Your Homework with AI
Get the answers you need in no time with our AI-driven, step-by-step assistance
Get Started


