Answered step by step
Verified Expert Solution
Link Copied!

Question

1 Approved Answer

Ex: In the table below are a list of ratings (out of 100) that individuals gave to a recent movie on Rotten Tomatoes.com. Movie ratings
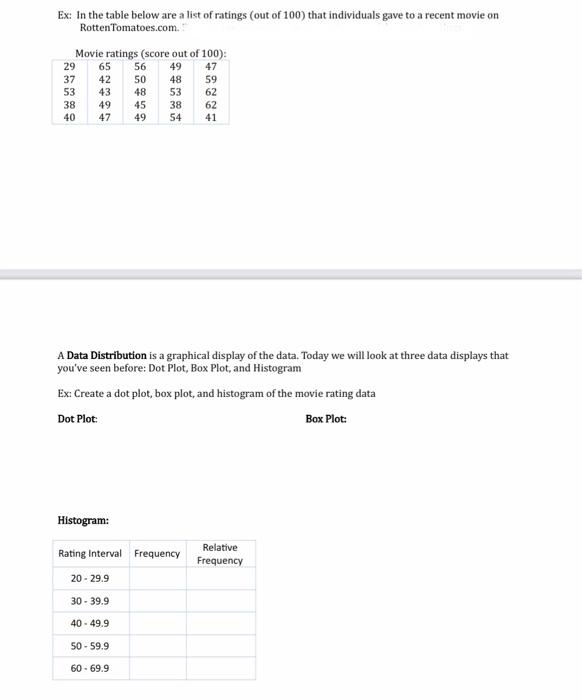
image text in transcribed
Ex: In the table below are a list of ratings (out of 100) that individuals gave to a recent movie on Rotten Tomatoes.com. Movie ratings (score out of 100): 29 42 53 38 49 45 62 65 56 50 48 49 48 37 53 47 59 62 43 38 54 40 47 49 41 A Data Distribution is a graphical display of the data. Today we will look at three data displays that you've seen before: Dot Plot, Box Plot, and Histogram Ex: Create a dot plot, box plot, and histogram of the movie rating data Dot Plot: Box Plot: Histogram: Rating Interval Frequency 20- 29.9 Relative Frequency 30 - 39.9 40 - 49.9 50 - 59.9 60 - 69.9

Step by Step Solution

There are 3 Steps involved in it

Step: 1

blur-text-image

Get Instant Access to Expert-Tailored Solutions

See step-by-step solutions with expert insights and AI powered tools for academic success

Step: 2

blur-text-image_2

Step: 3

blur-text-image_3

Ace Your Homework with AI

Get the answers you need in no time with our AI-driven, step-by-step assistance

Get Started

Recommended Textbook for

Financial Accounting Objective Questions And Explanations

Authors: Irvin N. Gleim

6th Edition

0917537718, 978-0917537714

More Books

Students also viewed these Accounting questions

Question

What is self-actualisation?

Answered: 1 week ago

Question

Distinguish between filtering and interpreting. (Objective 2)

Answered: 1 week ago