

Answered step by step
Verified Expert Solution
Question
1 Approved Answer
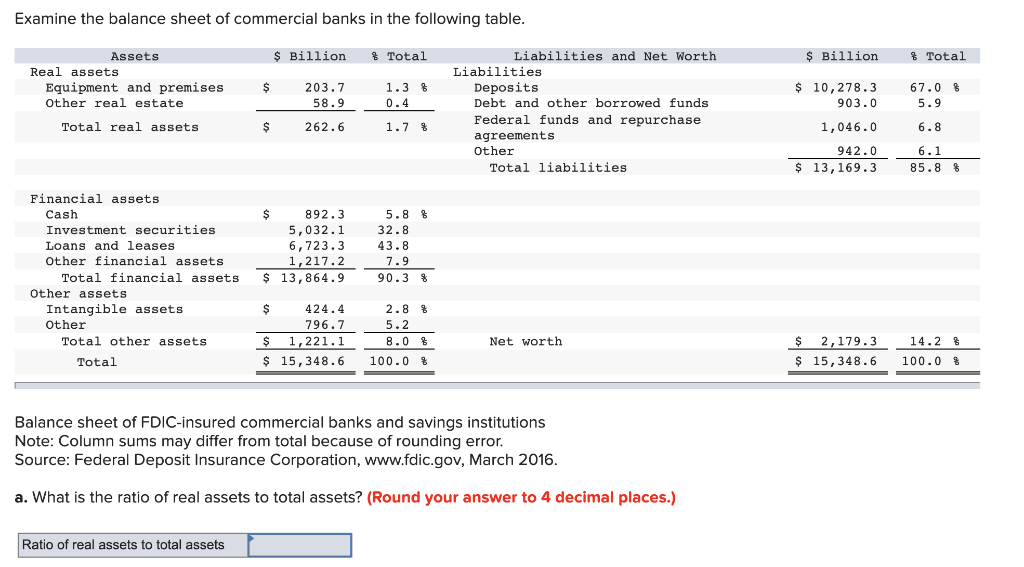
Examine the balance sheet of commercial banks in the following table. $ Billion Total $ Billion % Total Assets Real assets Equipment and premises Other
Step by Step Solution
There are 3 Steps involved in it
Step: 1

Get Instant Access to Expert-Tailored Solutions
See step-by-step solutions with expert insights and AI powered tools for academic success
Step: 2

Step: 3
Ace Your Homework with AI
Get the answers you need in no time with our AI-driven, step-by-step assistance
Get Started
The Ages Of The Investor A Critical Look At Life Cycle Investing
Authors: William J Bernstein
1st Edition
1478227133, 978-1478227137