Examine the cosr assumption. Do you think that they are realistic? why or why not


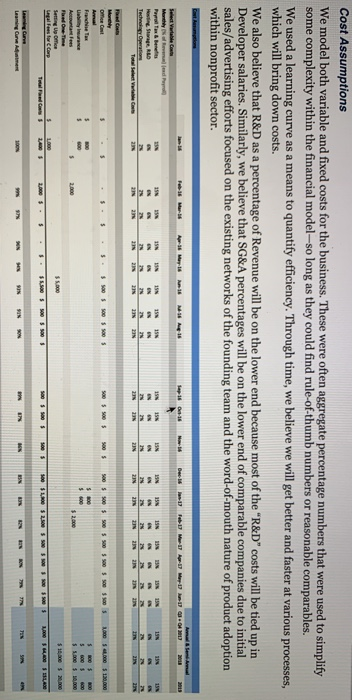
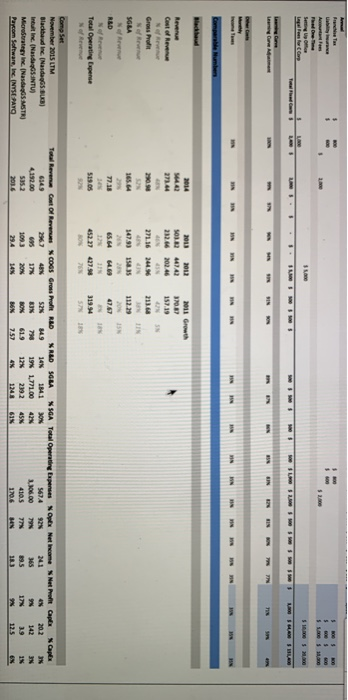
Cost Assumptions We model both variable and fixed costs for the business. These were often aggregate percentage numbers that were used to simplify some complexity within the financial model-so long as they could find rule-of-thumb numbers or reasonable comparables. We used a learning curve as a means to quantify efficiency. Through time, we believe we will get better and faster at various processes, which will bring down costs. We also believe that R&D as a percentage of Revenue will be on the lower end because most of the "R&D"costs will be tied up in Developer salaries. Similarly, we believe that SG&A percentages will be on the lower end of comparable companies due to initial sales/advertising efforts focused on the existing networks of the founding team and the word-of-mouth nature of product adoption within nonprofit sector. . Methylder 15 IN UN IN 15 15 UN 1SN IN IN IN 45 46 Hosting SRLD 4046 AN N N 2 2N ZIN ZIN 20 2N ZIN 2 Oceast 5 50 55 500S MONO se SO10 SO 50 News w Accountants $ Setting Up 1.00 . 1,400 3.500 Total des to 3. OS SOS s S. LO 40 L SL SLO Lean Gure Amen WN M Ares 5 $ 1 SM LAN w 8 EN 3 2014 4.4 273.44 2013 2012 2011 Growth SOL.242 232.66 202.46 Cost of Revenue Gross Profit 271.16 14 UN 1479315835 SOLA 213.00 IN 112-29 2015 72.18 R&D of Reven Total Operating Expense Nofree 65.64 469 11N 518.05 319.94 Como se November 2015 LTM Blackbed inc. (Nasdaq.) Intuit Inc. (NasdaqGSINTU) MicroStrategy Inc. (NasdaqMSTR) Pascom Software, Inc. (NYSE PAYO Total Revenue Cost Of Revenue COGS Gross Profit R&D R&D SGBA NSGA Total Operating Expenses NOWE Net income Net Profit Caps Nape 5249 14N 1841 BON 5674 92 202 IN 695 798 19% 1.771.00 3.106.00 365 142 5352 IN BOX 61.9 12 239.2 45% 410.5 77 89.5 17 3.9 1 B6% 7.57 1. 12.5 Cost Assumptions We model both variable and fixed costs for the business. These were often aggregate percentage numbers that were used to simplify some complexity within the financial model-so long as they could find rule-of-thumb numbers or reasonable comparables. We used a learning curve as a means to quantify efficiency. Through time, we believe we will get better and faster at various processes, which will bring down costs. We also believe that R&D as a percentage of Revenue will be on the lower end because most of the "R&D"costs will be tied up in Developer salaries. Similarly, we believe that SG&A percentages will be on the lower end of comparable companies due to initial sales/advertising efforts focused on the existing networks of the founding team and the word-of-mouth nature of product adoption within nonprofit sector. . Methylder 15 IN UN IN 15 15 UN 1SN IN IN IN 45 46 Hosting SRLD 4046 AN N N 2 2N ZIN ZIN 20 2N ZIN 2 Oceast 5 50 55 500S MONO se SO10 SO 50 News w Accountants $ Setting Up 1.00 . 1,400 3.500 Total des to 3. OS SOS s S. LO 40 L SL SLO Lean Gure Amen WN M Ares 5 $ 1 SM LAN w 8 EN 3 2014 4.4 273.44 2013 2012 2011 Growth SOL.242 232.66 202.46 Cost of Revenue Gross Profit 271.16 14 UN 1479315835 SOLA 213.00 IN 112-29 2015 72.18 R&D of Reven Total Operating Expense Nofree 65.64 469 11N 518.05 319.94 Como se November 2015 LTM Blackbed inc. (Nasdaq.) Intuit Inc. (NasdaqGSINTU) MicroStrategy Inc. (NasdaqMSTR) Pascom Software, Inc. (NYSE PAYO Total Revenue Cost Of Revenue COGS Gross Profit R&D R&D SGBA NSGA Total Operating Expenses NOWE Net income Net Profit Caps Nape 5249 14N 1841 BON 5674 92 202 IN 695 798 19% 1.771.00 3.106.00 365 142 5352 IN BOX 61.9 12 239.2 45% 410.5 77 89.5 17 3.9 1 B6% 7.57 1. 12.5


