Answered step by step
Verified Expert Solution
Question
1 Approved Answer
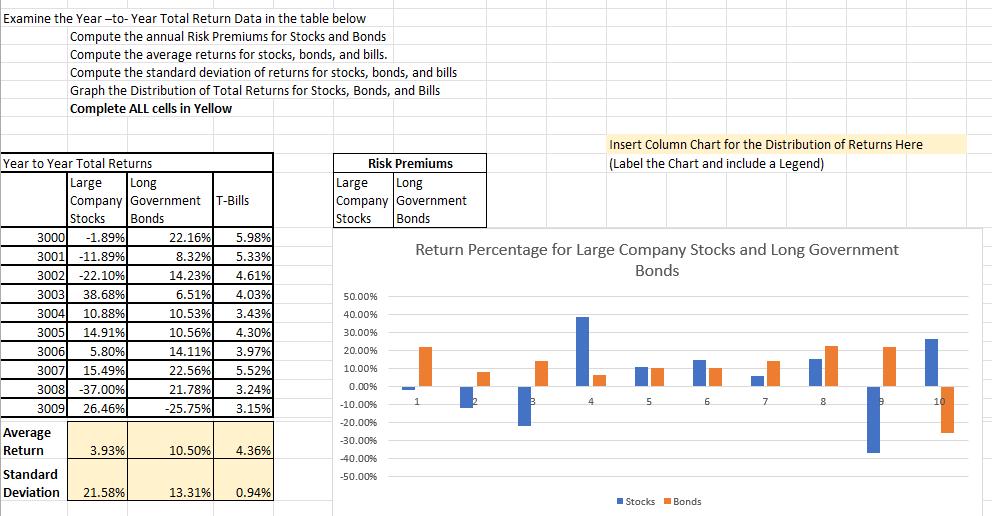
Examine the Year-to-Year Total Return Data in the table below Compute the annual Risk Premiums for Stocks and Bonds Compute the average returns for

Examine the Year-to-Year Total Return Data in the table below Compute the annual Risk Premiums for Stocks and Bonds Compute the average returns for stocks, bonds, and bills. Compute the standard deviation of returns for stocks, bonds, and bills Graph the Distribution of Total Returns for Stocks, Bonds, and Bills Complete ALL cells in Yellow Year to Year Total Returns Large Long Company Government Risk Premiums Insert Column Chart for the Distribution of Returns Here (Label the Chart and include a Legend) Large T-Bills Long Company Government Stocks Bonds Stocks Bonds 3000 -1.89% 22.16% 5.98% 3001 -11.89% 8.32% 5.33% Return Percentage for Large Company Stocks and Long Government 3002 3003 3004 10.88% 3005 14.91% 3006 5.80% 3007 15.49% 3008 -37.00% 3009 26.46% -22.10% 14.23% 4.61% Bonds 38.68% 6.51% 4.03% 10.53% 3.43% 10.56% 4.30% 50.00% 40.00% 30.00% 14.11% 3.97% 20.00% 22.56% 5.52% 10.00% 21.78% 3.24% -25.75% 0.00% 1 3.15% -10.00% 5 6 7 8 B 10 -20.00% Average -30.00% Return 3.93% 10.50% 4.36% -40.00% Standard -50.00% Deviation 21.58% 13.31% 0.94% Stocks Bonds
Step by Step Solution
There are 3 Steps involved in it
Step: 1
To compute the annual risk premiums for stocks and bonds we need to calculate the difference between ...
Get Instant Access to Expert-Tailored Solutions
See step-by-step solutions with expert insights and AI powered tools for academic success
Step: 2

Step: 3

Ace Your Homework with AI
Get the answers you need in no time with our AI-driven, step-by-step assistance
Get Started


