

Question
Example : Module Three Problem Set Jupyter Notebook V2-01Last Checkpoint: 21 hours ago(autosaved) R File Edit View Insert Cell Kernel Help Run CodeMarkdownRaw NBConvertHeading- Validate
Example :
Module Three Problem Set Jupyter Notebook V2-01Last Checkpoint: 21 hours ago(autosaved)
R
- File
- Edit
- View
- Insert
- Cell
- Kernel
- Help
Run
CodeMarkdownRaw NBConvertHeading-
Validate
Second Order Regression Models
In this notebook, you have been given a set of steps that will show you how to create a multiple regression model in R. It is very important to run the steps in order. Some steps depend on the outputs of earlier steps. Once you have run all the steps, you will be asked to create your own multiple regression model to help you answer the questions in Module Three the Problem Set. You are expected to write the R script yourself to answer these questions.
Reminder: If you have not already reviewed the Problem Set Report template for your Module Three Problem Set, be sure to do so now. That will give you an idea of the questions you will need to answer with the outputs of this script. You should use the code you are given as reference when writing your own scripts.
Step 1: Loading the Data Set
You are an analyst working for the government and you have access to a set of historical data that can be used to study wage growth of the labor force. Governments are interested in studying wage growth patterns based on their economic agenda. This data set has other economic factors that are related to wage growth. You will use this data set to create models for wage growth.
This block of R code will load theeconomicdata set from a CSV file. It will then display the first six rows of the data. Here are the variables contained in the data set:
| Variable | What does it represent? |
|---|---|
| wage_growth | Wage growth rate |
| inflation | Rate of inflation |
| unemployment | Unemployment rate |
| economy | Economy in recession or not in recession |
| gdp | GDP growth rate |
Note: This is a simulated data set based on a real-world problem.
Click the code section below and hit theRunbutton above.
In[1]:
economic read.csv(file='economic.csv', header=TRUE, sep=",")?# Print the first six rowsprint("head")head(economic, 6)
[1] "head"
| wage_growth | inflation | unemployment | economy | education | gdp |
|---|---|---|---|---|---|
| 7.30 | 4.49 | 3.56 | no_recession | college | 6.27 |
| 9.05 | 9.59 | 2.42 | no_recession | college | 9.44 |
| 10.08 | 11.36 | 1.23 | no_recession | post_graduate | 18.29 |
| 10.98 | 9.55 | 1.18 | no_recession | post_graduate | 19.96 |
| 8.54 | 8.63 | 2.54 | no_recession | high_school | 8.43 |
| 9.75 | 8.26 | 2.22 | no_recession | college | 17.85 |
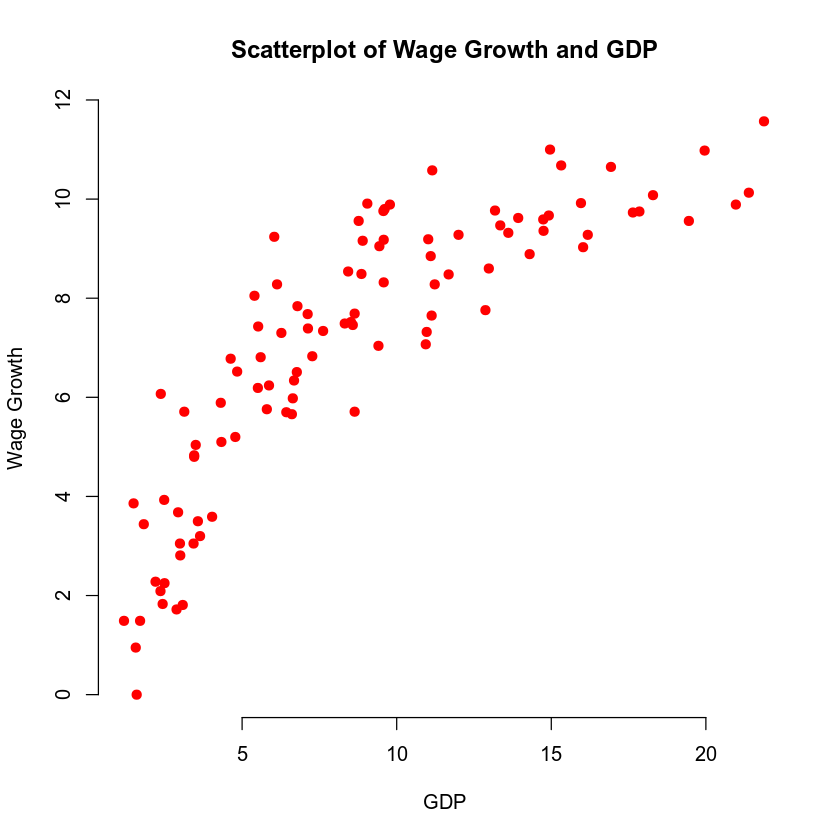
Step 2: Scatterplot of Wage Growth and GDP Growth
In this step, you will use theplotfunction in R to print the scatterplot for variableswage_growthandgdpin the data set.
Click the block of code below and hit theRunbutton above. NOTE: If the plot is not created, click the code section and hit theRunbutton again.
In[2]:
plot(economic$gdp, economic$wage_growth, main = "Scatterplot of Wage Growth and GDP", xlab = "GDP", ylab = "Wage Growth", col="red", pch = 19, frame = FALSE)


Step by Step Solution
There are 3 Steps involved in it
Step: 1

Get Instant Access to Expert-Tailored Solutions
See step-by-step solutions with expert insights and AI powered tools for academic success
Step: 2

Step: 3
Ace Your Homework with AI
Get the answers you need in no time with our AI-driven, step-by-step assistance
Get Started
An Introduction to the Mathematics of financial Derivatives
Authors: Salih N. Neftci
2nd Edition
978-0125153928, 9780080478647, 125153929, 978-0123846822