Answered step by step
Verified Expert Solution
Question
1 Approved Answer
30 Examples 11 13 Examples 1 A few customers give a company most of its ordere INVENTORY ANALYSIS Back at the turn of the
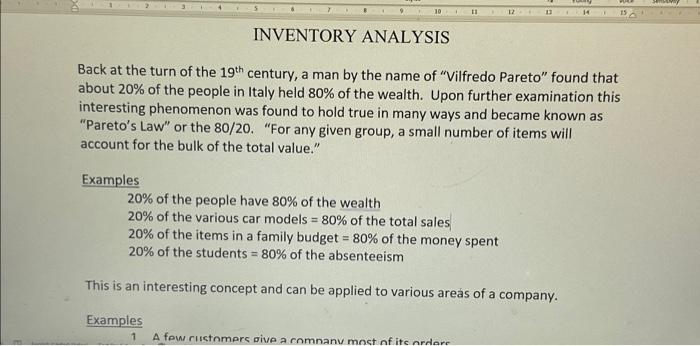
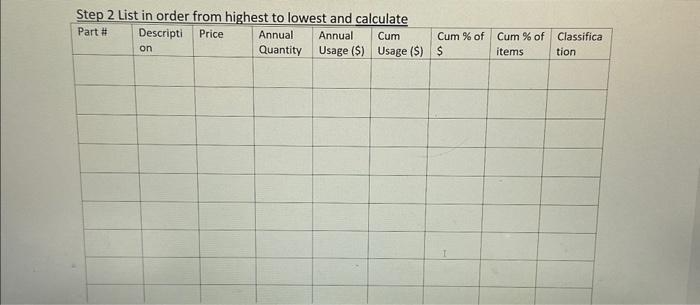
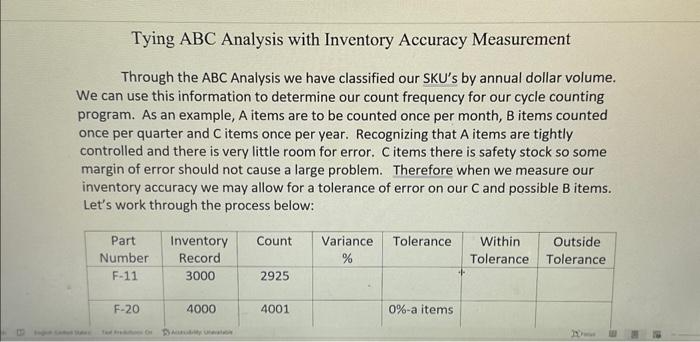
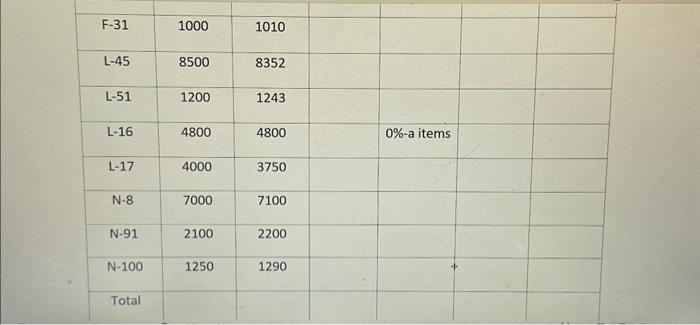
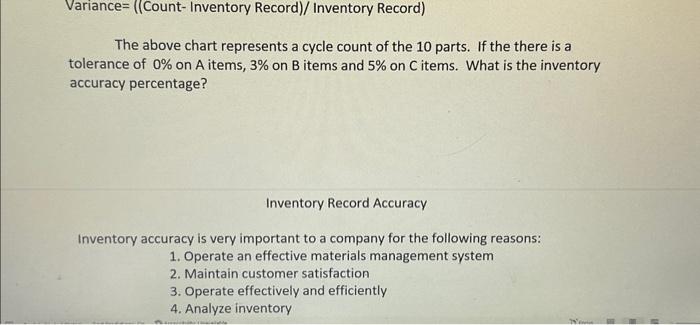
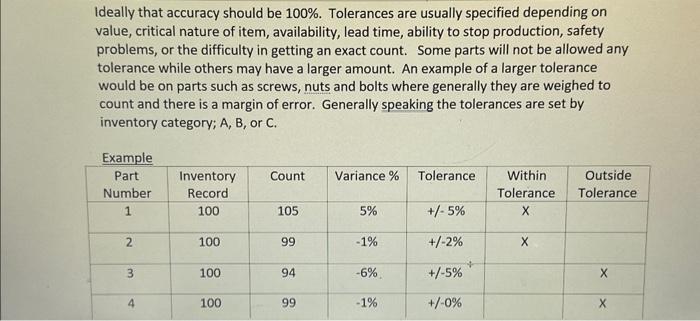
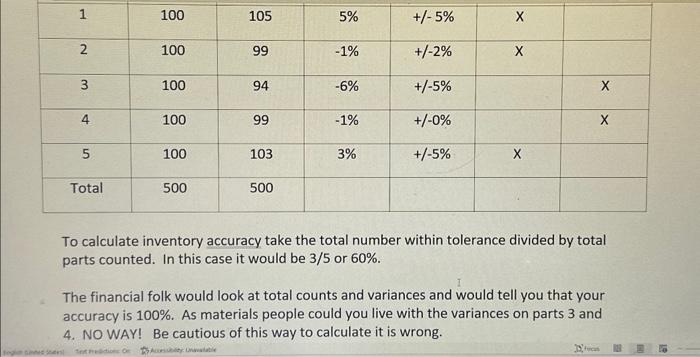
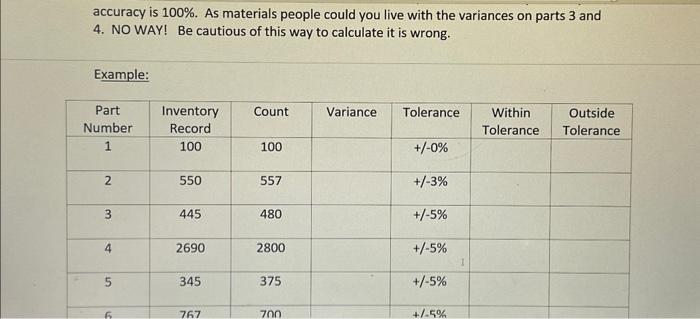
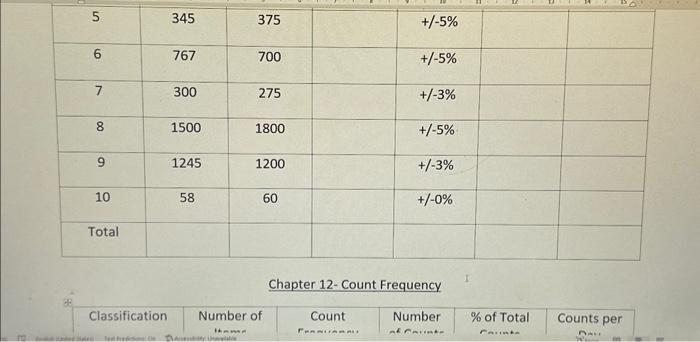
30 Examples 11 13 Examples 1 A few customers give a company most of its ordere INVENTORY ANALYSIS Back at the turn of the 19th century, a man by the name of "Vilfredo Pareto" found that about 20% of the people in Italy held 80% of the wealth. Upon further examination this interesting phenomenon was found to hold true in many ways and became known as "Pareto's Law" or the 80/20. "For any given group, a small number of items will account for the bulk of the total value." 20% of the people have 80% of the wealth 20% of the various car models = 80% of the total sales 20% of the items in a family budget = 80% of the money spent 20% of the students = 80% of the absenteeism This is an interesting concept and can be applied to various areas of a company. 14 15 Step 2 List in order from highest to lowest and calculate Part # Descripti Price Annual on Quantity Annual Usage ($) Cum Cum % of Cum % of Classifica Usage ($) $ items tion Tying ABC Analysis with Inventory Accuracy Measurement Through the ABC Analysis we have classified our SKU's by annual dollar volume. We can use this information to determine our count frequency for our cycle counting program. As an example, A items are to be counted once per month, B items counted once per quarter and C items once per year. Recognizing that A items are tightly controlled and there is very little room for error. C items there is safety stock so some margin of error should not cause a large problem. Therefore when we measure our inventory accuracy we may allow for a tolerance of error on our C and possible B items. Let's work through the process below: Part Number F-11 F-20 Inventory Count Variance Record % 3000 4000 Aya 2925 4001 Tolerance 0%-a items Within Tolerance Outside Tolerance E F-31 L-45 L-51 L-16 L-17 N-8 N-91 N-100 Total 1000 8500 1200 4800 4000 7000 2100 1250 1010 8352 1243 4800 3750 7100 2200 1290 0%-a items Variance= ((Count- Inventory Record)/ Inventory Record) The above chart represents a cycle count of the 10 parts. If the there is a tolerance of 0% on A items, 3% on B items and 5% on C items. What is the inventory accuracy percentage? Inventory Record Accuracy Inventory accuracy is very important to a company for the following reasons: 1. Operate an effective materials management system 2. Maintain customer satisfaction 3. Operate effectively and efficiently. 4. Analyze inventory Ideally that accuracy should be 100%. Tolerances are usually specified depending on value, critical nature of item, availability, lead time, ability to stop production, safety problems, or the difficulty in getting an exact count. Some parts will not be allowed any tolerance while others may have a larger amount. An example of a larger tolerance would be on parts such as screws, nuts and bolts where generally they are weighed to count and there is a margin of error. Generally speaking the tolerances are set by inventory category; A, B, or C. Example Part Number 1 2 3 4 Inventory Record 100 100 100 100 Count 105 99 94 99 Variance % 5% -1% -6% -1% Tolerance +/- 5% +/-2% +/-5% +/-0% + Within Tolerance X X Outside Tolerance X X 1 2 m 4 5 Total 100 100 100 100 100 500 105 99 94 99 103 500 5% -1% -6% -1% 3% +/-5% +/-2% +/-5% +/-0% +/-5% X X X X To calculate inventory accuracy take the total number within tolerance divided by total parts counted. In this case it would be 3/5 or 60%. The financial folk would look at total counts and variances and would tell you that your accuracy is 100%. As materials people could you live with the variances on parts 3 and 4. NO WAY! Be cautious of this way to calculate it is wrong. Tot Freddion On Accessibly Unavaatle ficas accuracy is 100%. As materials people could you live with the variances on parts 3 and 4. NO WAY! Be cautious of this way to calculate it is wrong. Example: Part Number 1 2 3 4 ST 6 Inventory Record 100 550 445 2690 345 767 Count 100 557 480 2800 375 700 Variance Tolerance +/-0% +/-3% +/-5% +/-5% +/-5% +/-5% 1 Within Outside Tolerance Tolerance 10 6 7 8 9 10 Total Classification 345 767 300 1500 1245 58 375 BabyUnal 700 275 1800 1200 60 Number of Hame +/-5% +/-5% +/-3% +/-5% +/-3% +/-0% Chapter 12- Count Frequency Count FERNLIAMALI Number at Casinte % of Total Counte Counts per DAY
Step by Step Solution
★★★★★
3.52 Rating (145 Votes )
There are 3 Steps involved in it
Step: 1
Paretos Law or the 8020 principle suggests that in many situations roughly 20 of the inputs or facto...
Get Instant Access to Expert-Tailored Solutions
See step-by-step solutions with expert insights and AI powered tools for academic success
Step: 2

Step: 3

Ace Your Homework with AI
Get the answers you need in no time with our AI-driven, step-by-step assistance
Get Started


