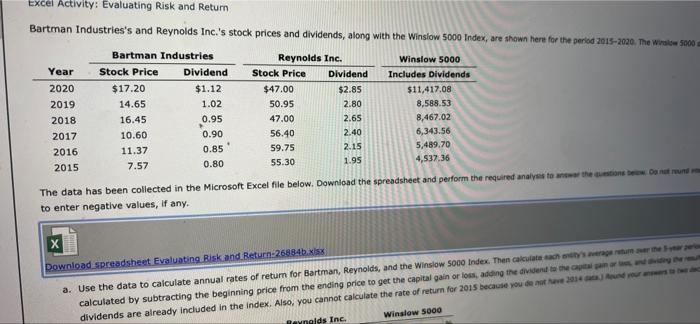
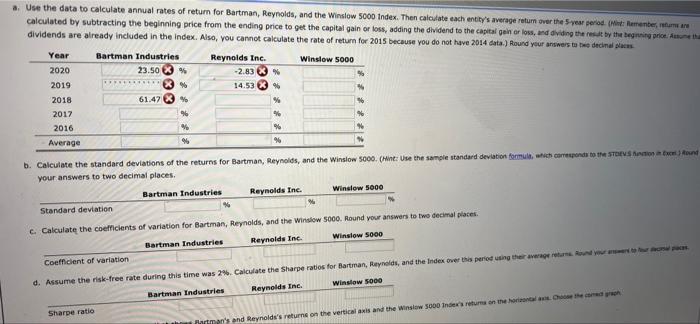
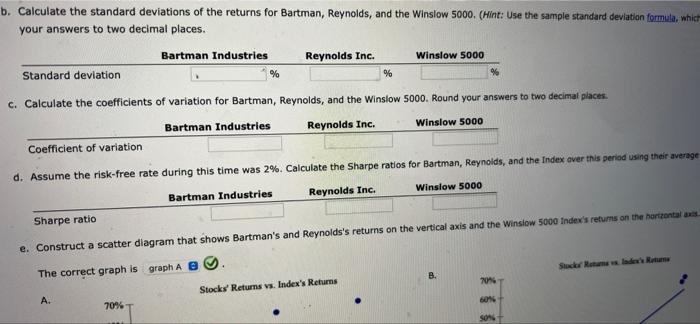
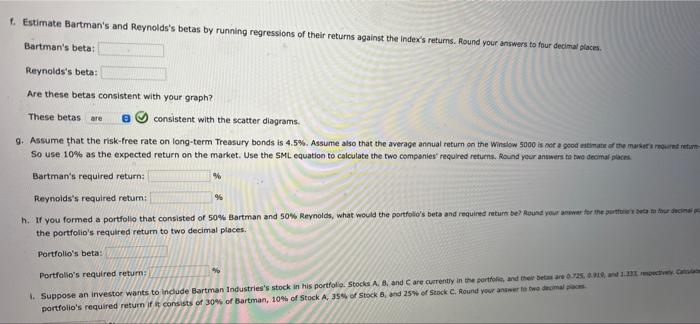
Excel Activity: Evaluating Risk and Return Bartman Industries's and Reynolds Inc.'s stock prices and dividends, along with the Winslow 5000 Index, are shown here for the period 2015-2020. The Walow5000 Bartman Industries Reynolds Inc. Winslow 5000 Year Stock Price Dividend Stock Price Dividend Includes Dividends 2020 $17.20 $1.12 $47.00 $2.85 $11.417.08 2019 14.65 1.02 50.95 2.80 8,588.53 2018 16.45 0.95 47.00 2.65 8,467.02 2017 10.60 0.90 56.40 2.40 6,343.56 11.37 2016 0.85 59.75 2.15 5,489.70 7.57 0.80 2015 55.30 1.95 4,537.36 The data has been collected in the Microsoft Excel file below. Download the spreadsheet and perform the required analyses to the card to enter negative values, if any, X Download spreadsheet Evaluating Risk and Return:26884b.xlsx a. Use the data to calculate annual rates of return for Bartman, Reynolds, and the Winslow 5000 Index. Then cam calculated by subtracting the beginning price from the ending price to get the capital gain or loss, adding the divided to the card dividends are already included in the index. Also, you cannot calculate the rate of return for 2015 because you do not have 2014 Winslow 5000 Povnalds Inc. Year a. Use the data to calculate annual rates of return for Bartman, Reynolds, and the Winslow 5000 Index. Then calculate each entity's average ratum over the year seriod. (Min: Remember, turmare calculated by subtracting the beginning price from the ending price to get the capital gain or loss, adding the dividend to the capital gain or lows, and dividing the red by the beginning product dividends are already included in the index. Also, you cannot calculate the rate of return for 2015 because you do not have 2014 data) Round your answers to the decinalen Bartman Industries Reynolds Inc. Winslow 5000 2020 23.50 3% -2.83 % 2019 14.53 2018 61.47 % % 2017 96 2016 % Average 96 96 96 b. Calculate the standard deviations of the returns for Bartman, Reynolds, and the Winslow 5000. (Hint: Use the sample standard deviation formula, which correspond to the Station your answers to two decimal places. Bartman Industries Reynolds Inc. Winslow 5000 Standard deviation c. Calculate the coefficients of variation for Bartman, Reynolds, and the Winslow 5000. Round your answers to two decimal places Bartman Industries Reynolds Inc. Winslow 5000 Coefficient of variation d. Assume the risk-free rate during this time was 2%. Calculate the Sharpe ratios for Bartman, Reynolds, and the Index over the period using the ageretur Bartman Industries Reynolds Inc. Winslow 5000 Sharpe ratio tman's and Reynolds's returns on the vertical axis and the Winslow 5000 Indreture on the b. Calculate the standard deviations of the returns for Bartman, Reynolds, and the Winslow 5000. (Hint: Use the sample standard deviation formula, whict your answers to two decimal places. Bartman Industries Reynolds Inc. Winslow 5000 Standard deviation % % c. Calculate the coefficients of variation for Bartman, Reynolds, and the Winslow 5000. Round your answers to two decimal places. Bartman Industries Reynolds Inc. Winslow 5000 Coefficient of variation d. Assume the risk-free rate during this time was 2%. Calculate the Sharpe ratios for Bartman, Reynolds, and the Index over this period using their average Winslow 5000 Bartman Industries Reynolds Inc. Sharpe ratio e. Construct a scatter diagram that shows Bartman's and Reynolds's returns on the vertical axis and the Winslow 5000 Index's returns on the nortzontals The correct graph is graph A B B. 70 Stocks Returns vs. Index's Returns A. . 7096 1. Estimate Bartman's and Reynolds's betas by running regressions of their returns against the Index's returns. Round your answers to four decimal places Bartman's beta Reynolds's beta: Are these betas consistent with your graph? These betas are e consistent with the scatter diagrams 9. Assume that the risk-free rate on long-term Treasury bonds is 4,5%. Assume also that the average annual return on the Winslow 5000 is not a good estimate of the market required return So use 10% as the expected return on the market. Use the SML equation to calculate the two companies required returns. Round your answers to two decimal places Bartman's required return: Reynolds's required retur: h you formed a portfolio that consisted of 50% Bartman and 50% Reynolds, what would the portfolio's bets and required return bey Round your wer for the produce the portfolio's required return to two decimal places. 96 Portfolio's beta Portfolio's required return; 1. Suppose an investor wants to include Bartman Industries's stock in his portfolio Stocks A, B and Care currently in the parts and there are portfolio's required return it is consists of 30% of Bartman, 10% of Stock A, 3556 of Stock Band 25of Stock C. Round your answer to com