

Answered step by step
Verified Expert Solution
Question
1 Approved Answer
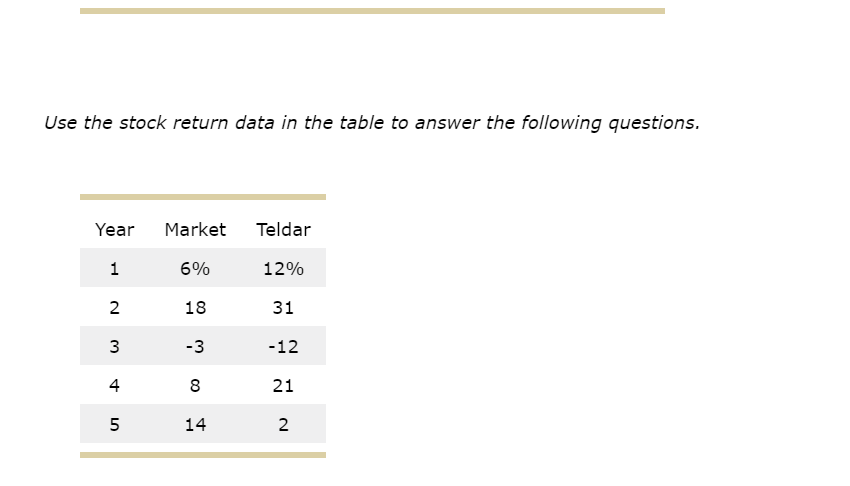
Excel can be used. Use the stock return data in the table to answer the following questions. Year Market Teldar 1 6% 12% 2 18
Excel can be used.
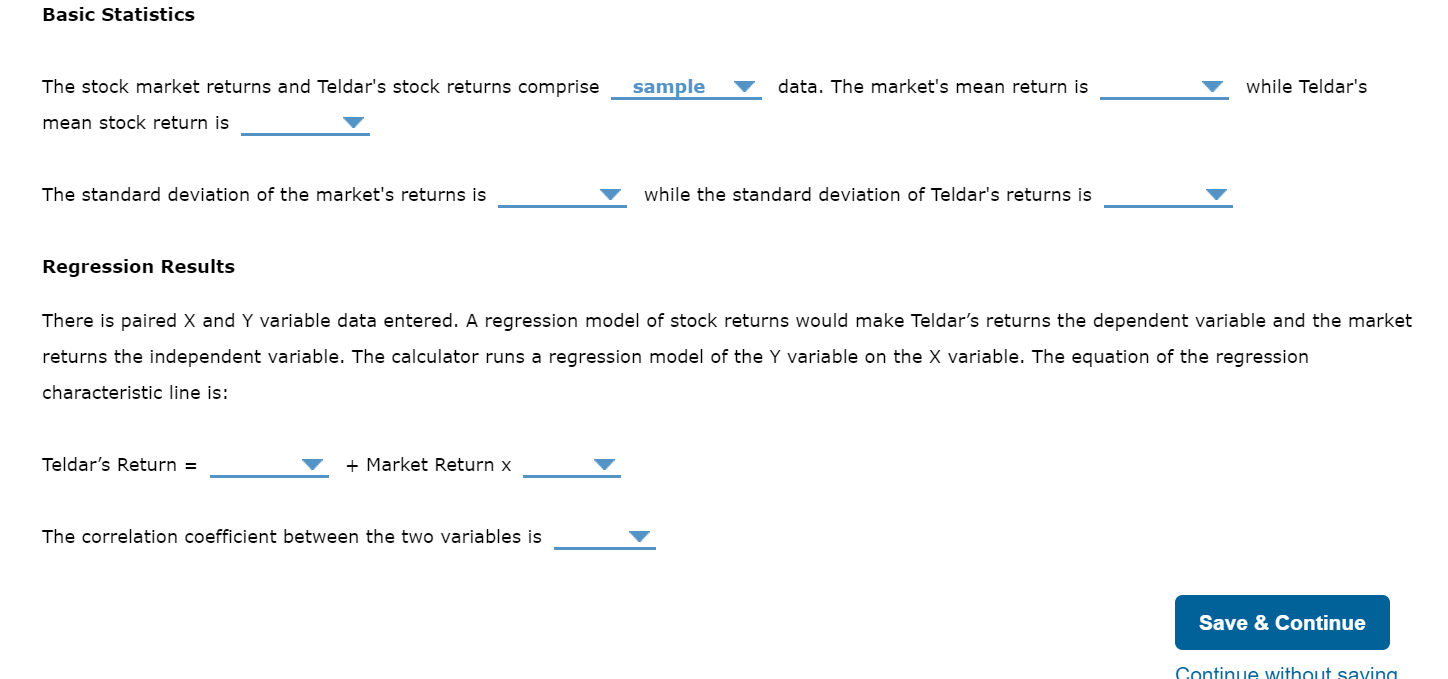
Use the stock return data in the table to answer the following questions. Year Market Teldar 1 6% 12% 2 18 31 3 -3 -12 4 8 21 5 14 2 Basic Statistics The stock market returns and Teldar's stock returns comprise sample data. The market's mean return is while Teldar's mean stock return is The standard deviation of the market's returns is while the standard deviation of Teldar's returns is Regression Results There is paired X and Y variable data entered. A regression model of stock returns would make Teldar's returns the dependent variable and the market returns the independent variable. The calculator runs a regression model of the Y variable on the X variable. The equation of the regression characteristic line is: Teldar's Return = + Market Return x The correlation coefficient between the two variables is Save & Continue Continue without savingStep by Step Solution
There are 3 Steps involved in it
Step: 1

Get Instant Access to Expert-Tailored Solutions
See step-by-step solutions with expert insights and AI powered tools for academic success
Step: 2

Step: 3
Ace Your Homework with AI
Get the answers you need in no time with our AI-driven, step-by-step assistance
Get Started
Financial Management Of Health Care Organizations
Authors: William N. Zelman, Michael J. McCue, Alan R. Millikan, Noah D. Glick
2nd Edition
063123098X, 9780631230984