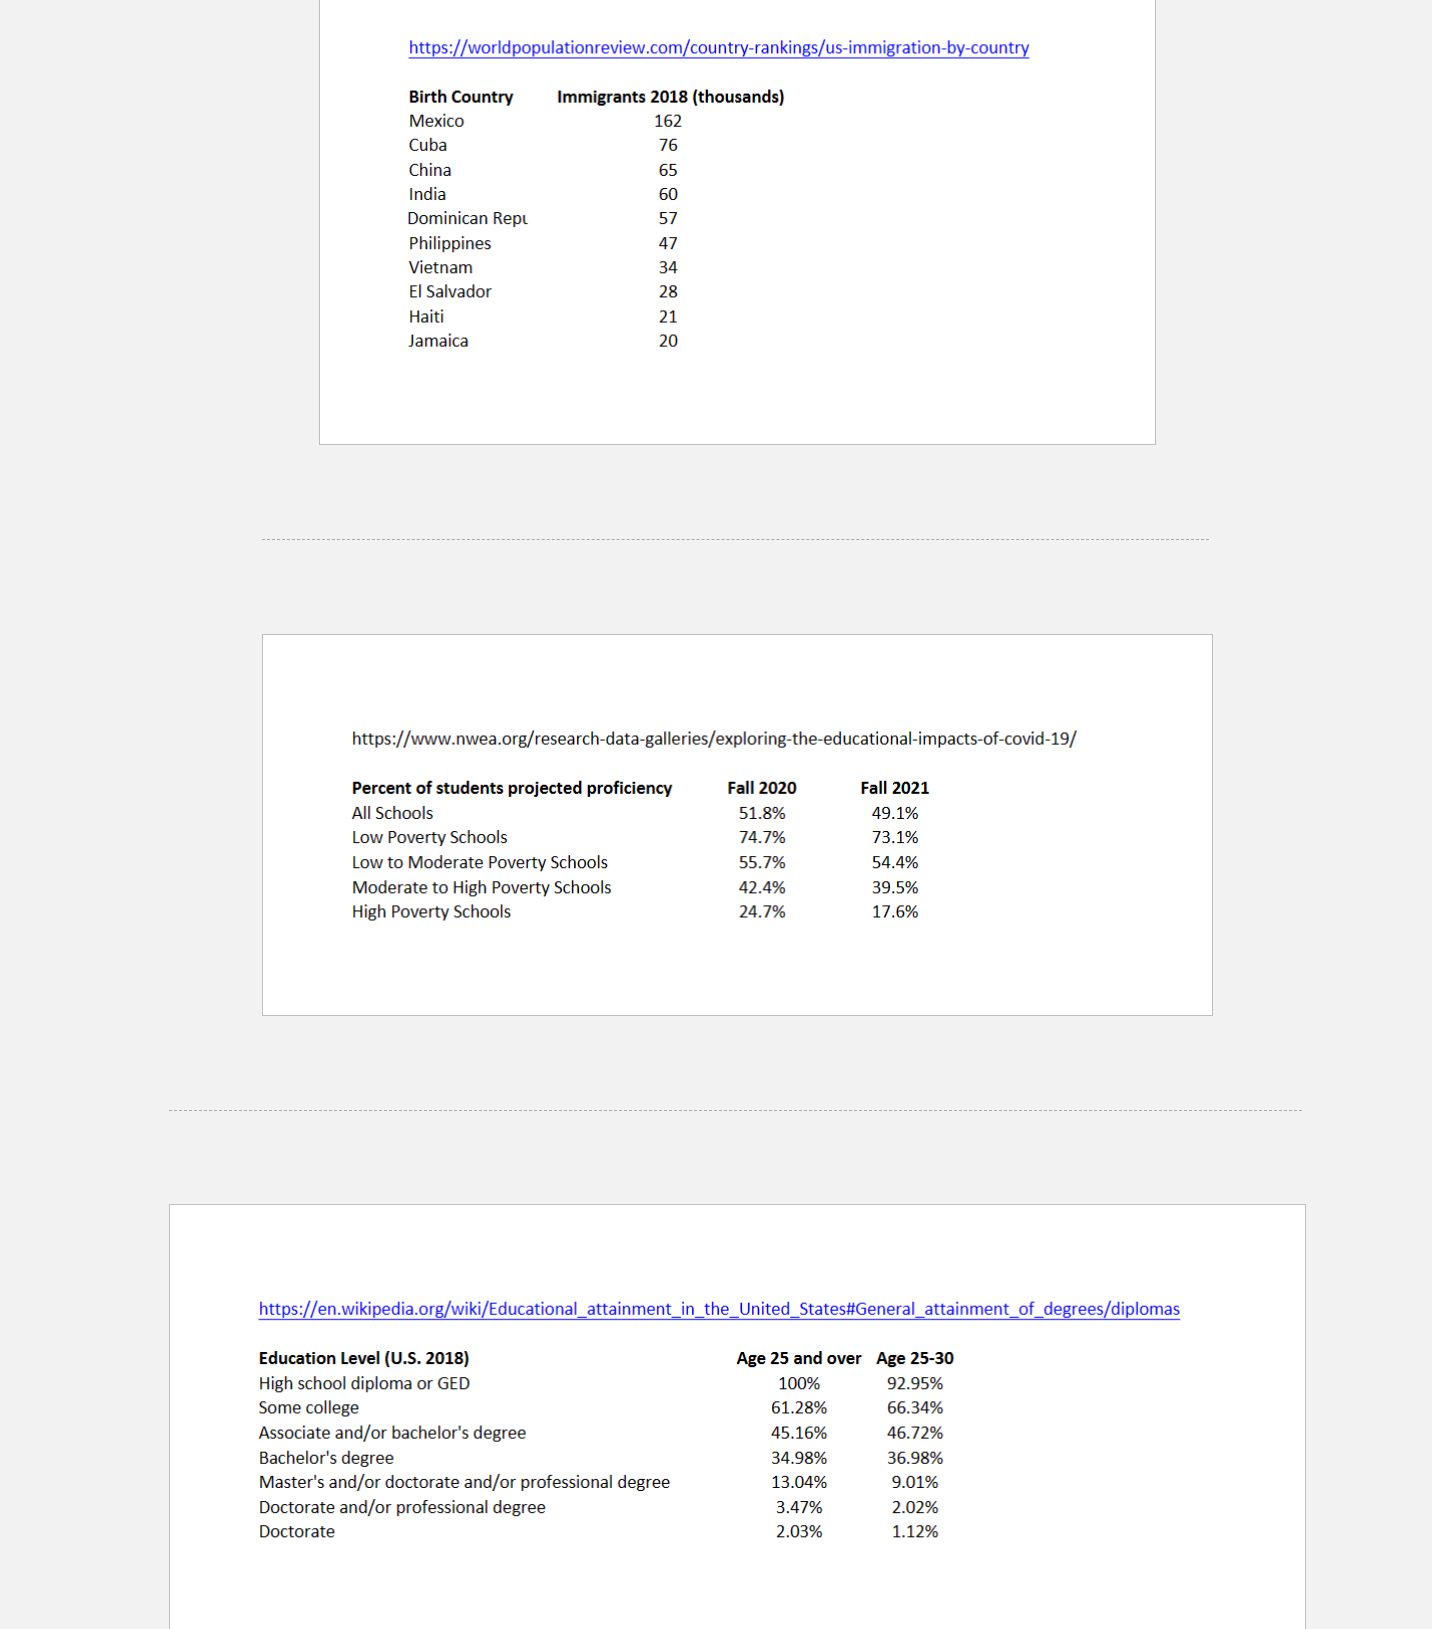
Excel file: fffhttps://worldpopulationreview.com/country-rankings/us-immigration-by-country Birth Country Immigrants 2018 (thousands) Mexico 162 Cuba 76 China 65 India 60 Dominican Rept 57 Philippines 47 Vietnam 34 El Salvador
Excel file:
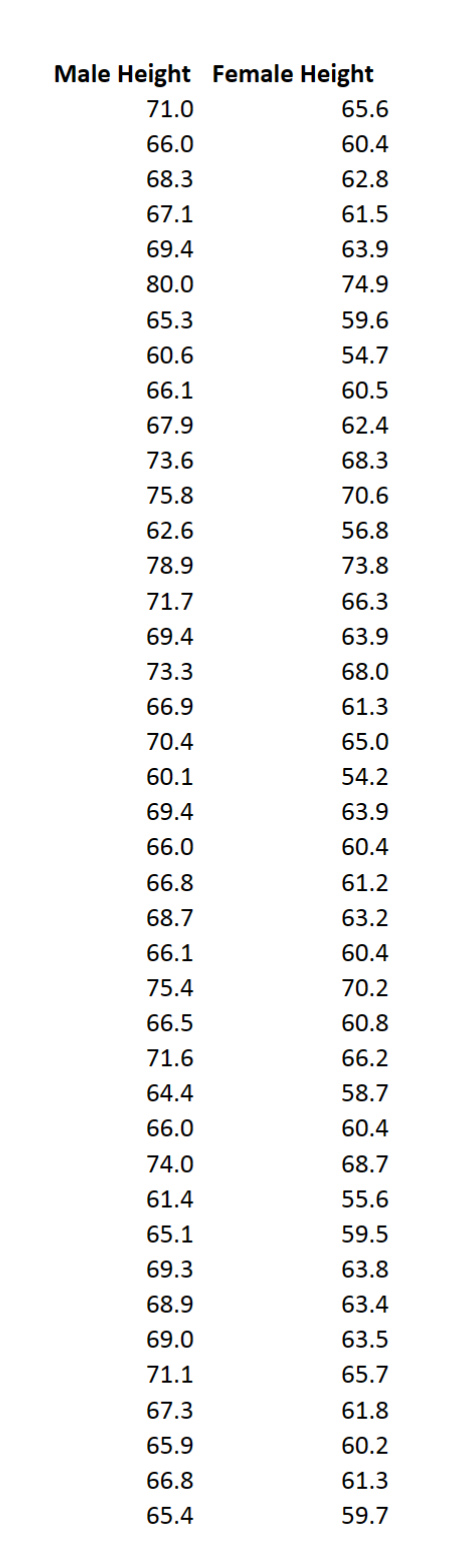
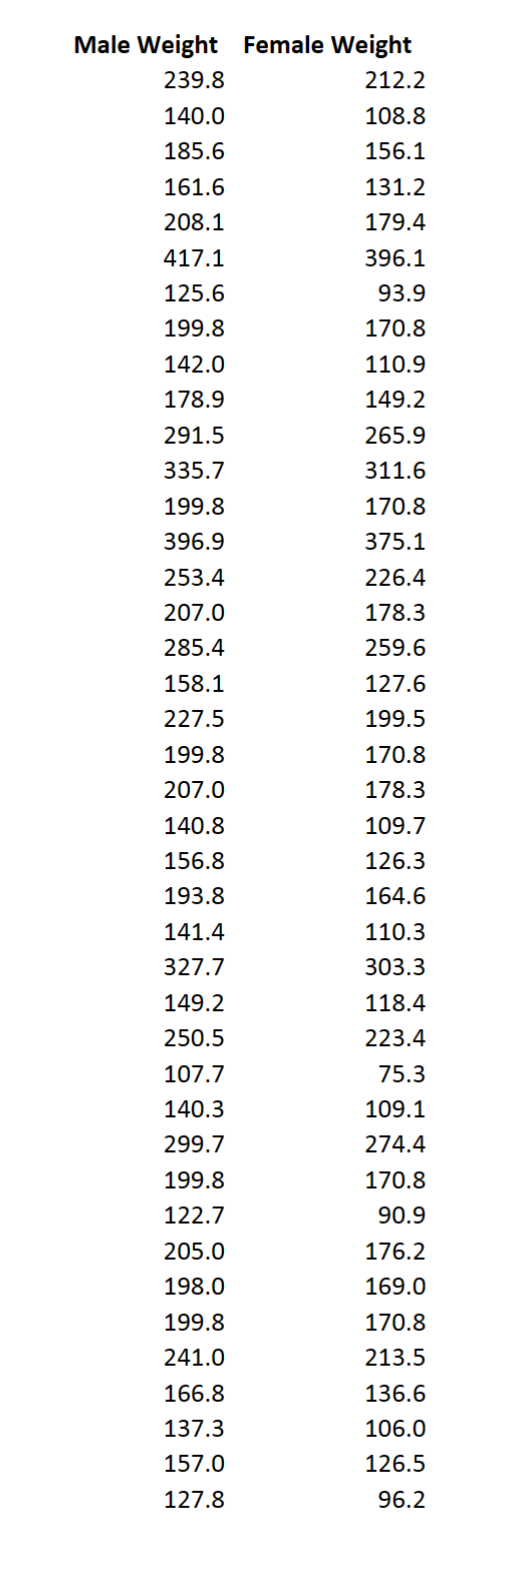
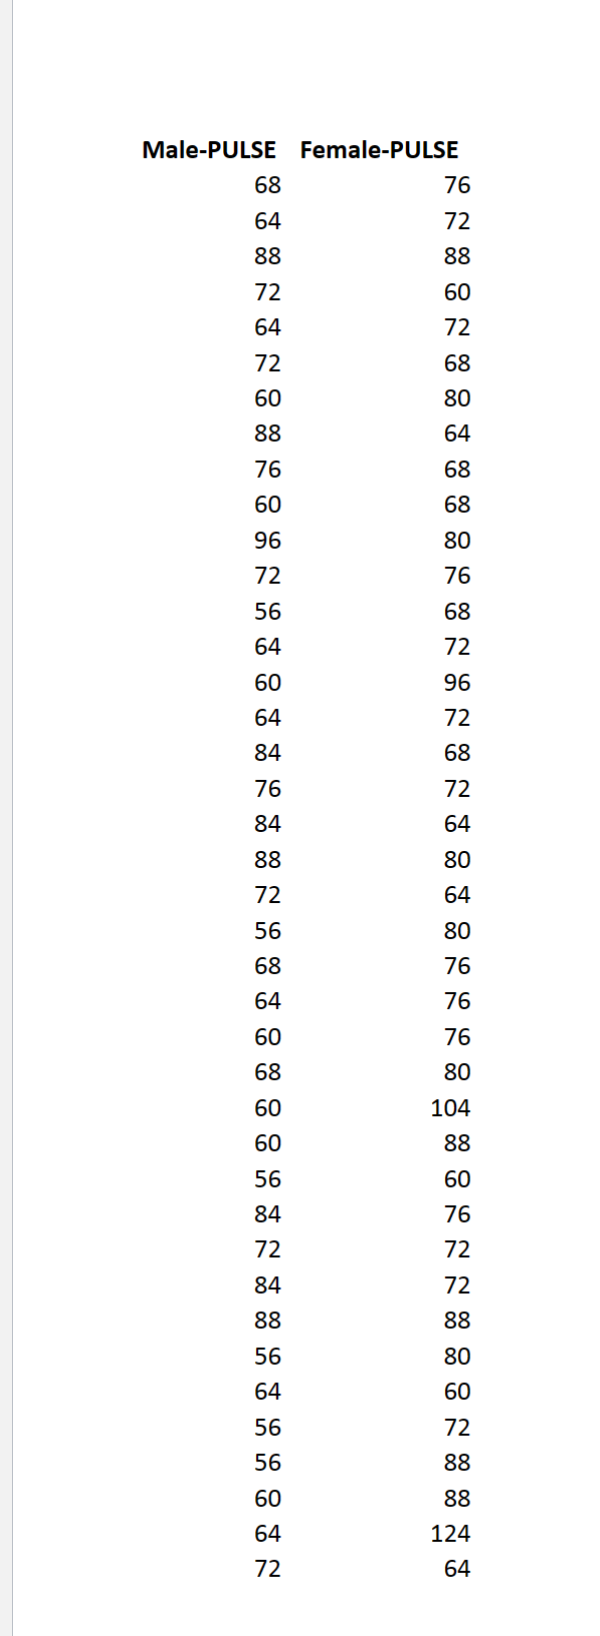
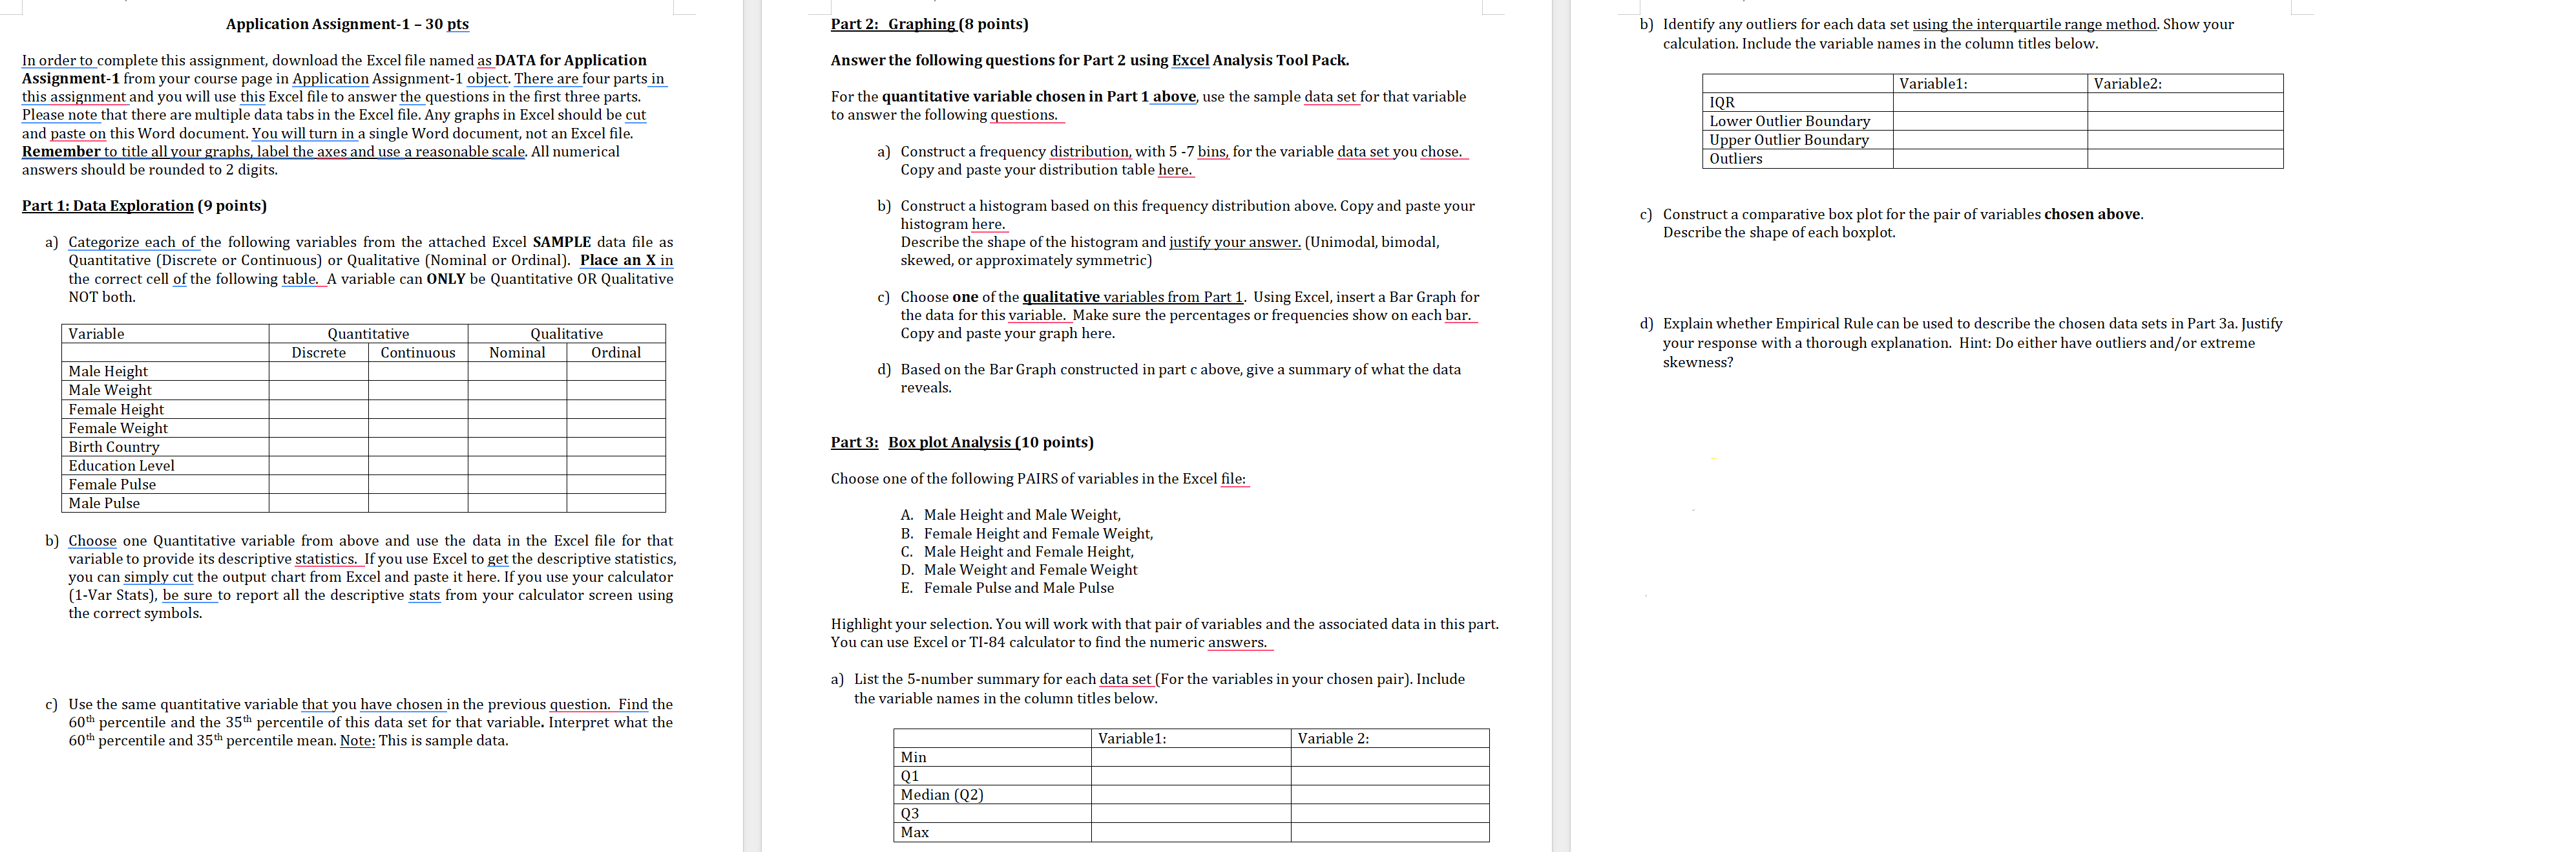
\f\f\fhttps://worldpopulationreview.com/country-rankings/us-immigration-by-country Birth Country Immigrants 2018 (thousands) Mexico 162 Cuba 76 China 65 India 60 Dominican Rept 57 Philippines 47 Vietnam 34 El Salvador 28 Haiti 21 Jamaica 20 https://www.nwea.org/research-data-galleries/exploring-the-educational-impacts-of-covid-19/ Percent of students projected proficiency Fall 2020 Fall 2021 All Schools 51.8% 49.1% Low Poverty Schools 74.7% 73.1% Low to Moderate Poverty Schools 55.7% 54.4% Moderate to High Poverty Schools 42.4% 39.5% High Poverty Schools 24.7% 17.6% https://en.wikipedia.org/wiki/Educational_attainment_in_the_United_States#General_attainment_of_degrees/diplomas Education Level (U.S. 2018 Age 25 and over Age 25-30 High school diploma or GED 100% 92.95% Some college 61.28% 6.34% Associate and/or bachelor's degree 45.16% 46.72% Bachelor's degree 34.98% 36.98% Master's and/or doctorate and/or professional degree 13.04% 9.01% Doctorate and/or professional degree 3.479 2.02% Doctorate 2.03% 1.12%Application Assignment-1 - 30 pts In order to complete this assignment, download the Excel file named as DATA for Application Assignment-1 from your course page in Application Assignment-1 object. There are four parts in this assignment and you willuse this Excel file o answer the questions in the first three parts. Please note that there are multiple data tabs in the Excel file. Any graphs in Excel should be cut and paste on this Word document. You will turn in a single Word document, not an Excel file. Remember to title all your graphs, label the axes and use a reasonable scale. All numerical answers should be rounded to 2 digits. Part 1: Data Exploration (9 points) a) Categorize each of the following variables from the attached Excel SAMPLE data file as Quantitative (Discrete or Continuous) or Qualitative (Nominal or Ordinal). Place an X in the correct cell of the following table. A variable can ONLY be Quantitative OR Qualitative NOT both. Variable Quantitative Qualitative Discrete | Continuous | Nominal | _Ordinal Male Height Male Weight Female Height Female Weight Birth Country Education Level Female Pulse Male Pulse b) Choose one Quantitative variable from above and use the data in the Excel file for that variable to provide its descriptive statistics. If you use Excel to get the descriptive statistics, you can simply cut the output chart from Excel and paste it here. If you use your calculator (1-Var Stats), be sure to report all the descriptive stats from your calculator screen using the correct symbols. ) Use the same quantitative variable that you have chosen in the previous question. Find the 60 percentile and the 35% percentile of this data set for that variable. Interpret what the 60 percentile and 35 percentile mean. Note: This is sample data. Part2: Graphing (8 points) Answer the following questions for Part 2 using Excel Analysis Tool Pack. For the quantitative variable chosen in Part 1 above, use the sample data set for that variable to answer the following questions. a) Constructa frequency distribution, with 5 -7 bins, for the variable data set you chose. Copy and paste your distribution table he! b) Constructa histogram based on this frequency distribution above. Copy and paste your histogram here. Describe the shape of the histogram and justify your answer. (Unimodal, skewed, or approximately symmetric) odal, ) Choose one of the qualitative variables from Part 1. Using Excel, insert a Bar Graph for the data for this variable. Make sure the percentages or frequencies show on each bar. Copy and paste your graph here. d) Based on the Bar Graph constructed in part above, give a summary of what the data reveals. Part3: Boxplot Analysis (10 points) Choose one of the following PAIRS of variables in the Excel fil Male Height and Male Weight, Female Height and Female Weight, Male Height and Female Height, Male Weight and Female Weight Female Pulse and Male Pulse moows Highlight your selection. You will work with that pair of variables and the associated data in this part. 'You can use Excel or TI-84 calculator to find the numeric answers. a) List the 5-number summary for each data set (For the variables in your chosen pair). Include the variable names in the column titles below. Variablel: Variable 2: ) Identify any outliers for each data set using the interquartile range method. Show your caleulation. Include the variable names in the column titles below. Variablel: Variable2: IQR Lower Outlier Boundary Upper Outlier Boundary Outliers
Step by Step Solution
There are 3 Steps involved in it
Step: 1
Get Instant Access to Expert-Tailored Solutions
See step-by-step solutions with expert insights and AI powered tools for academic success
Step: 2
Step: 3
Ace Your Homework with AI
Get the answers you need in no time with our AI-driven, step-by-step assistance