excel
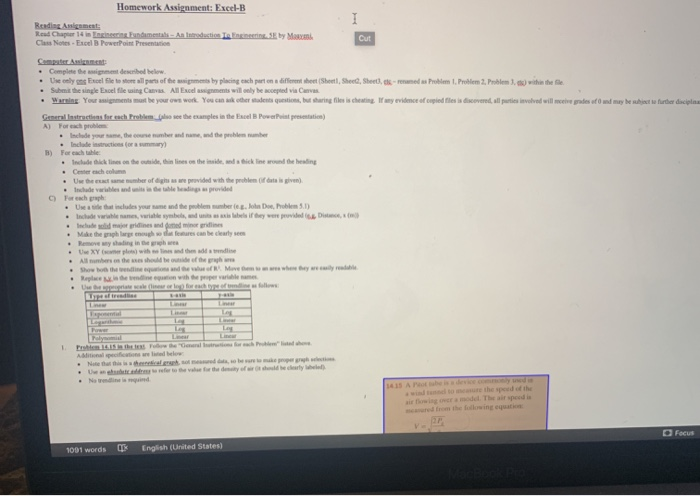
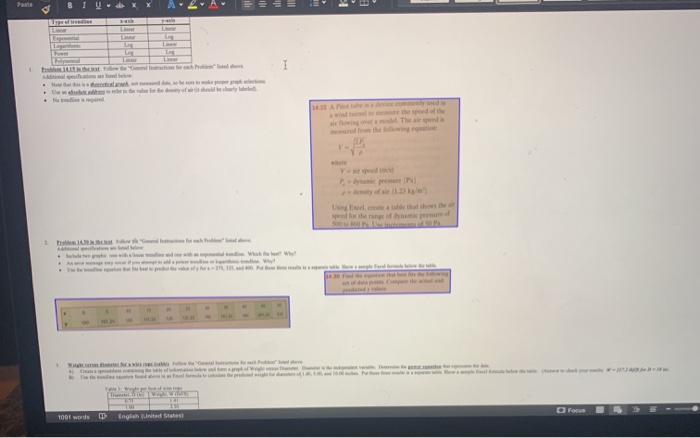
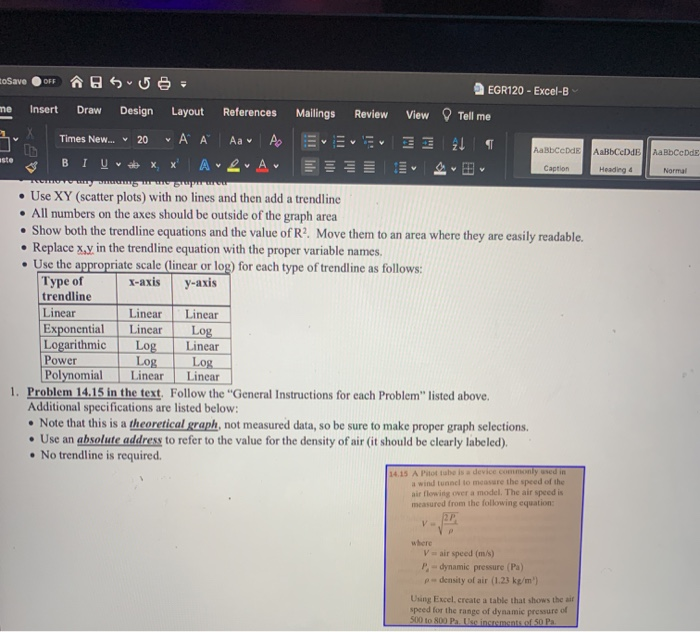
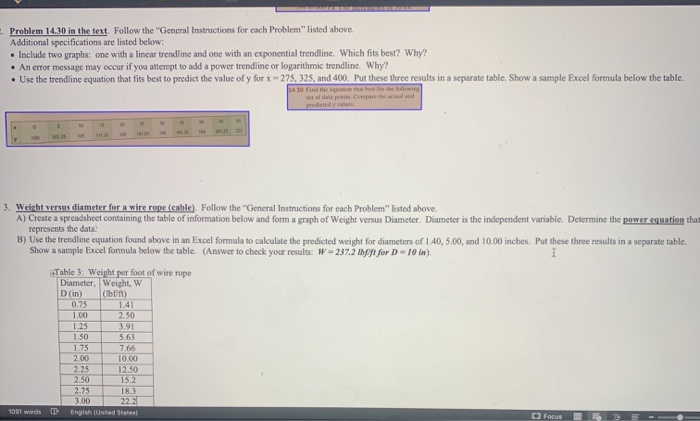
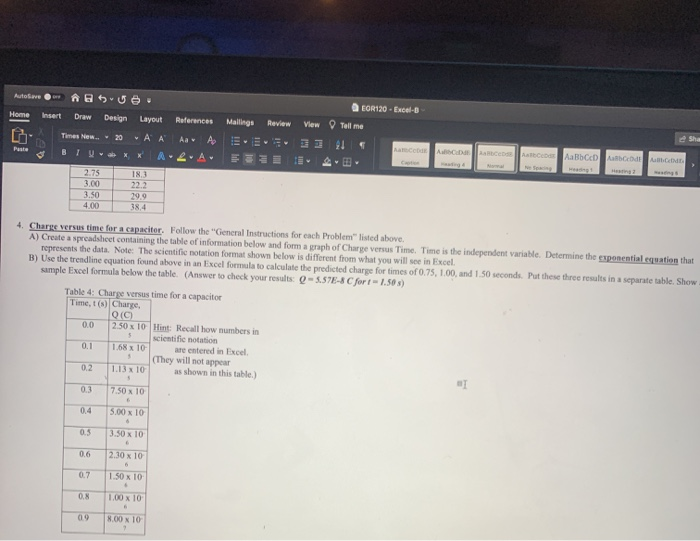
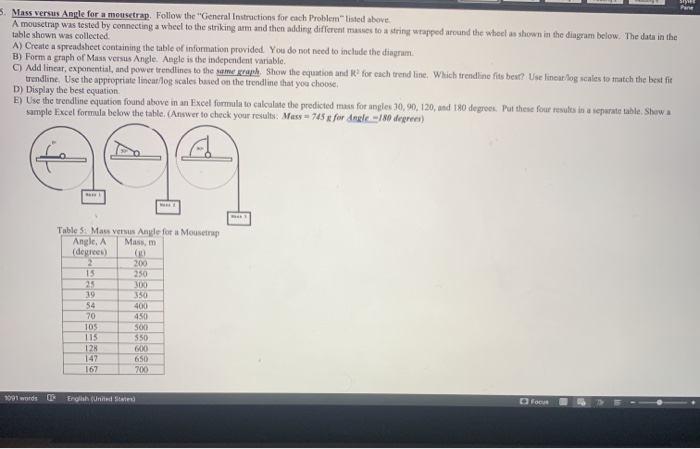
I Homework Assignment: Excel-B Reading Assignment Read Chapter 14 in Engineering. Fundamentals - Antection de serie SE by Marxa. Cut Class Notes - Excel B PowerPoint Presentation Computer Assignment Complete the great described below. Use only one Fancel file to store all parts of the assignments by placing each part en a different sheet Shetl, Sheed, Sheet), eks - renamed as Problem I. Problem 2. Problem 3. s) within the file. Submit the single Excel file using Canvas All Excel assignments will only be cepted via Curves Warning Your aigments must be your own work. You can make other students questions, but sharing file is cheating any evidence of copied files is discovered, all parties involved will neceive grades of und may be subject to further disciplina General Instructions for each Problem also see the examples in the Basel PowerPoint presentation) A) Forsche . Include your sm, the consumer and the probleme Includestructions for commary) . Include thick lines on the wide, thin lines on the inside and tickline word the healing Cech.com . Uw he et une number of digs as we provided with the problem of data is given) Include varies and is in de ble being provided C) For each Use that includes your name and the problembere. Jole Double 5.1) Inde wees, verembe, Iecies and und in die Make the shares can be clearly se Remove way shine XY with All the shooter los Poly 1 Alpecific red below D Focus 1001 words English (United States) 1 Luis Pasthe device commonly used in The speed V speed for the range of dynami pre 1001 words Save 0 EGR120 - Excel-B-Saved to my Mac Insert Draw Design Layout References Mailings Review View Tell me Times New.. 12 A - A A A2 41 CODE All Arab AaBCD ABCDE ABC heading! Hea w Petten 14. Follow the forehe Indien on what do we Wsch Wy! Any or if you were lege . Uw inte haft het prodat the value of 271, 2, and these this is the Should feelow the le 14.30 Pad the count that he is the town predicted y sus 0 100 1014 0 1 A Crewe geding telefombowalmar Weight verwendependent de 250 4 Dute perdoring the white where were there for et sted from abaya villa TA thes Health weeted by wipe 1091 words English (United States) D Focus AutoSave 2 EGR120 - Excel-B-Saved to my Mac Review View Tell me Home Insert Draw Design Layout References Mailings Times New... 12 A A Aav A. BIUXX A LA Assos ABCD Abde DADA Caprio Posle 4 Charges follow the Genetics for each blond terve A Cristal Wash Tendent variable. Der er to the best formatowe warto Award punt de vedere. Tout Angebote de De 1 21 10 Te English (United States Focus Aabb ABCD AdB Carton AabLCD Heading Perle dings Home Class Notes - Excel B PowerPoint Presentation Computer Assignment: Complete the assignment described below. Use only one Excel file to store all parts of the assignments by placing each part on a different sheet (Sheetl, Sheet2, Sheet), sis -- renamed as Problem I, Problem 2, Problem 3, cte) with the file. Submit the single Excel file using Canvas. All Excel assignments will only be accepted via Canvas WarningYour assignments must be your own work. You can ask other students questions, but sharing files is cheating. If any evidence of copied files is discovered, all parties involved will receive grades of O and may be subject to further disciplinary action General Instructions for each Problem (also see the examples in the Excel PowerPoint presentation) A) For each problem: Include your name, the course number and name, and the problem number Include instructions (or a summary) B) For each table: Include thick lines on the outside, thin lines on the inside, and a thick line around the heading Center each column Use the exact same number of digits as are provided with the problem (if data is given) Include variables and units in the table headings as provided C) For cach graph Use a title that includes your name and the problem number(es., John Doe Problem 5.1) Include variable names, variable symbols, and units as axis labels if they were provided (6., Distance, * (m) Include solid major ridlines and dotted minor gridlines Make the graph large enough so that features can be clearly seen Remove any shading in the graph area Use XY (scatter plots) with no lines and then add a trendline All numbers on the axes should be outside of the graph are Show both the trendline equations and the value of R. Move them to an area where they are easily readable Replace in the trendline equation with the proper variable names - Use the priate scale (linear or log) for each type of trendline as follows: Type of trendline Linea Linear Linear Los Linear 16/01 ods Engine toSave OFF AS56- EGR120 - Excel-B me Insert Draw Times New... 20 v AaBbce de AaBbCeDdB Aa BbCode V v Caption Heading 4 Normal . Design Layout References Mallings Review View Tell me X * ' A 1 B IU x x A LA THIS Use XY (scatter plots) with no lines and then add a trendline All numbers on the axes should be outside of the graph area Show both the trendline equations and the value of R? Move them to an area where they are easily readable. Replace x.y in the trendline equation with the proper variable names. Use the appropriate scale (linear or log) for each type of trendline as follows: Type of X-axis y-axis trendline Linear Linear Linear Exponential Linear Log Logarithmic Log Linear Power Log Log Polynomial Linear Linear 1. Problem 14.15 in the text. Follow the "General Instructions for each Problem" listed above. Additional specifications are listed below: . Note that this is a theoretical graph, not measured data, so be sure to make proper graph selections. Use an absolute address to refer to the value for the density of air (it should be clearly labeled) No trendline is required. 14.15 A Pobe is a device commonly used in a wind tunnel to measure the speed of the air flowing over a model. The air speed is measured from the following equation: V- Vair speed (m/s) dynamic pressure (Pa) p-density of air (1.23 kg/m') Using Excel. create a table that shows the air speed for the range of dynamic pressure of 500 to 800 Pa Instamant 50 Pa . Problem 14.30 in the text. Follow the "General Instructions for each Problem" listed above. Additional specifications are listed below: . Include two graphs: one with a linear trendline and one with an exponential trendline. Which fits best? Why? An error message may occur if you attempt to add a power trendline or logarithmic trendline. Why? Use the trendline equation that fits best to predict the value of y for x - 275, 325, and 400. Put these three results in a separate table. Show a sample Excel formula below the table. del pred 3. Weight versus diameter for a wire rope (cable). Follow the "General Instructions for cach Problem" listed above. A) Create a spreadsheet containing the table of information below and form a graph of Weight versus Diameter. Diameter is the independent variable. Determine the power equation that represents the data B) Use the trendline equation found above in an Excel formula to calculate the predicted weight for diameters of 140,5.00, and 10.00 inches. Put these three results in a separate table. Show a sample Excel formula below the table. (Answer to check your results: W - 237.2 for D-10 in). 1 Table 3: Weight per foot of wire rope Diameter. Weight, W (lbf) 0.75 2.50 1.25 3.91 1.50 Din 1.00 5.60 1.75 7.66 2.00 10.00 2.25 12.50 230 15.2 18.3 3.00 Engish (United States) 2.75 1001 words D Focus Autofave suu Home Insert Draw Design Layout References EOR120 - Excel-B View Tell me Mallings Review Times New... 20 + A Sha Paste 1 Uwax X CAD ABCD AD ABCDE 2.75 3.00 3.50 4.00 18.3 22.2 29.9 38,4 4. Charge versus time for a capaciter. Follow the "General Instructions for each Problem" listed above A) Create a spreadsheet containing the table of information below and form a graph of Charge versus Time Time is the independent variable. Determine the exponential equation that represents the data. Note: The scientific notation format shown below is different from what you will see in Excel B) Use the trendline equation found above in an Excel formula to calculate the predicted charge for times of 0.75, 1.00, and 150 seconds. Put these three results in a separate table. Show sample Excel formula below the table. (Answer to check your results 0-3.57E-8 Cfort -1.50 ) Table 4: Charge versus time for a capacitor Time, t) Charge QIC 0.0 2.50 x 10 Hint: Recall how numbers in scientific notation 0.1 1.68 x 10 are entered in Excel (They will not appear 0.2 1.13 x 10 as shown in this table) 5 0.3 7.50 x 10 0.4 5.00 x 10 6 3.50 x 10 0.5 0.6 230 x 10 0.7 1.50 x 10 0.8 1.00 x 10 6 8.00 x 10 09 SUS 5. Mass versus Angle for a mousetrap. Follow the "General Instructions for each Problem" listed above. A mousetrap was tested by connecting a wheel to the striking arm and then adding different masses to a string wrapped around the wheel as shown in the diagram below. The data in the table shown was collected. A) Create a spreadsheet containing the table of information provided. You do not need to include the diagram B) Form a graph of Mass versus Angle. Angle is the independent variable C) Add linear, exponential, and power trendlines to the same graph Show the equation and R for each trend line. Which trendline fits best? Use linear log scales to match the best fit trendline. Use the appropriate lincar/log scales based on the trendline that you choose D) Display the best equation E) Use the trendline equation found above in an Excel formula to calculate the predicted mass for angles 30, 90, 120, and 180 degrees. Put these four results in a separate table. Show a sample Excel formula below the table. (Answer to check your results: Mess = 745g for Angle 180 degrees) Table 5: Mass Versus Angle for a Mousetrap Angle, A Mass, m (degrees) ( 2 200 15 250 25 300 39 350 54 400 70 450 105 500 115 550 128 600 147 650 167 700 1001 words English (United States D Focus I Homework Assignment: Excel-B Reading Assignment Read Chapter 14 in Engineering. Fundamentals - Antection de serie SE by Marxa. Cut Class Notes - Excel B PowerPoint Presentation Computer Assignment Complete the great described below. Use only one Fancel file to store all parts of the assignments by placing each part en a different sheet Shetl, Sheed, Sheet), eks - renamed as Problem I. Problem 2. Problem 3. s) within the file. Submit the single Excel file using Canvas All Excel assignments will only be cepted via Curves Warning Your aigments must be your own work. You can make other students questions, but sharing file is cheating any evidence of copied files is discovered, all parties involved will neceive grades of und may be subject to further disciplina General Instructions for each Problem also see the examples in the Basel PowerPoint presentation) A) Forsche . Include your sm, the consumer and the probleme Includestructions for commary) . Include thick lines on the wide, thin lines on the inside and tickline word the healing Cech.com . Uw he et une number of digs as we provided with the problem of data is given) Include varies and is in de ble being provided C) For each Use that includes your name and the problembere. Jole Double 5.1) Inde wees, verembe, Iecies and und in die Make the shares can be clearly se Remove way shine XY with All the shooter los Poly 1 Alpecific red below D Focus 1001 words English (United States) 1 Luis Pasthe device commonly used in The speed V speed for the range of dynami pre 1001 words Save 0 EGR120 - Excel-B-Saved to my Mac Insert Draw Design Layout References Mailings Review View Tell me Times New.. 12 A - A A A2 41 CODE All Arab AaBCD ABCDE ABC heading! Hea w Petten 14. Follow the forehe Indien on what do we Wsch Wy! Any or if you were lege . Uw inte haft het prodat the value of 271, 2, and these this is the Should feelow the le 14.30 Pad the count that he is the town predicted y sus 0 100 1014 0 1 A Crewe geding telefombowalmar Weight verwendependent de 250 4 Dute perdoring the white where were there for et sted from abaya villa TA thes Health weeted by wipe 1091 words English (United States) D Focus AutoSave 2 EGR120 - Excel-B-Saved to my Mac Review View Tell me Home Insert Draw Design Layout References Mailings Times New... 12 A A Aav A. BIUXX A LA Assos ABCD Abde DADA Caprio Posle 4 Charges follow the Genetics for each blond terve A Cristal Wash Tendent variable. Der er to the best formatowe warto Award punt de vedere. Tout Angebote de De 1 21 10 Te English (United States Focus Aabb ABCD AdB Carton AabLCD Heading Perle dings Home Class Notes - Excel B PowerPoint Presentation Computer Assignment: Complete the assignment described below. Use only one Excel file to store all parts of the assignments by placing each part on a different sheet (Sheetl, Sheet2, Sheet), sis -- renamed as Problem I, Problem 2, Problem 3, cte) with the file. Submit the single Excel file using Canvas. All Excel assignments will only be accepted via Canvas WarningYour assignments must be your own work. You can ask other students questions, but sharing files is cheating. If any evidence of copied files is discovered, all parties involved will receive grades of O and may be subject to further disciplinary action General Instructions for each Problem (also see the examples in the Excel PowerPoint presentation) A) For each problem: Include your name, the course number and name, and the problem number Include instructions (or a summary) B) For each table: Include thick lines on the outside, thin lines on the inside, and a thick line around the heading Center each column Use the exact same number of digits as are provided with the problem (if data is given) Include variables and units in the table headings as provided C) For cach graph Use a title that includes your name and the problem number(es., John Doe Problem 5.1) Include variable names, variable symbols, and units as axis labels if they were provided (6., Distance, * (m) Include solid major ridlines and dotted minor gridlines Make the graph large enough so that features can be clearly seen Remove any shading in the graph area Use XY (scatter plots) with no lines and then add a trendline All numbers on the axes should be outside of the graph are Show both the trendline equations and the value of R. Move them to an area where they are easily readable Replace in the trendline equation with the proper variable names - Use the priate scale (linear or log) for each type of trendline as follows: Type of trendline Linea Linear Linear Los Linear 16/01 ods Engine toSave OFF AS56- EGR120 - Excel-B me Insert Draw Times New... 20 v AaBbce de AaBbCeDdB Aa BbCode V v Caption Heading 4 Normal . Design Layout References Mallings Review View Tell me X * ' A 1 B IU x x A LA THIS Use XY (scatter plots) with no lines and then add a trendline All numbers on the axes should be outside of the graph area Show both the trendline equations and the value of R? Move them to an area where they are easily readable. Replace x.y in the trendline equation with the proper variable names. Use the appropriate scale (linear or log) for each type of trendline as follows: Type of X-axis y-axis trendline Linear Linear Linear Exponential Linear Log Logarithmic Log Linear Power Log Log Polynomial Linear Linear 1. Problem 14.15 in the text. Follow the "General Instructions for each Problem" listed above. Additional specifications are listed below: . Note that this is a theoretical graph, not measured data, so be sure to make proper graph selections. Use an absolute address to refer to the value for the density of air (it should be clearly labeled) No trendline is required. 14.15 A Pobe is a device commonly used in a wind tunnel to measure the speed of the air flowing over a model. The air speed is measured from the following equation: V- Vair speed (m/s) dynamic pressure (Pa) p-density of air (1.23 kg/m') Using Excel. create a table that shows the air speed for the range of dynamic pressure of 500 to 800 Pa Instamant 50 Pa . Problem 14.30 in the text. Follow the "General Instructions for each Problem" listed above. Additional specifications are listed below: . Include two graphs: one with a linear trendline and one with an exponential trendline. Which fits best? Why? An error message may occur if you attempt to add a power trendline or logarithmic trendline. Why? Use the trendline equation that fits best to predict the value of y for x - 275, 325, and 400. Put these three results in a separate table. Show a sample Excel formula below the table. del pred 3. Weight versus diameter for a wire rope (cable). Follow the "General Instructions for cach Problem" listed above. A) Create a spreadsheet containing the table of information below and form a graph of Weight versus Diameter. Diameter is the independent variable. Determine the power equation that represents the data B) Use the trendline equation found above in an Excel formula to calculate the predicted weight for diameters of 140,5.00, and 10.00 inches. Put these three results in a separate table. Show a sample Excel formula below the table. (Answer to check your results: W - 237.2 for D-10 in). 1 Table 3: Weight per foot of wire rope Diameter. Weight, W (lbf) 0.75 2.50 1.25 3.91 1.50 Din 1.00 5.60 1.75 7.66 2.00 10.00 2.25 12.50 230 15.2 18.3 3.00 Engish (United States) 2.75 1001 words D Focus Autofave suu Home Insert Draw Design Layout References EOR120 - Excel-B View Tell me Mallings Review Times New... 20 + A Sha Paste 1 Uwax X CAD ABCD AD ABCDE 2.75 3.00 3.50 4.00 18.3 22.2 29.9 38,4 4. Charge versus time for a capaciter. Follow the "General Instructions for each Problem" listed above A) Create a spreadsheet containing the table of information below and form a graph of Charge versus Time Time is the independent variable. Determine the exponential equation that represents the data. Note: The scientific notation format shown below is different from what you will see in Excel B) Use the trendline equation found above in an Excel formula to calculate the predicted charge for times of 0.75, 1.00, and 150 seconds. Put these three results in a separate table. Show sample Excel formula below the table. (Answer to check your results 0-3.57E-8 Cfort -1.50 ) Table 4: Charge versus time for a capacitor Time, t) Charge QIC 0.0 2.50 x 10 Hint: Recall how numbers in scientific notation 0.1 1.68 x 10 are entered in Excel (They will not appear 0.2 1.13 x 10 as shown in this table) 5 0.3 7.50 x 10 0.4 5.00 x 10 6 3.50 x 10 0.5 0.6 230 x 10 0.7 1.50 x 10 0.8 1.00 x 10 6 8.00 x 10 09 SUS 5. Mass versus Angle for a mousetrap. Follow the "General Instructions for each Problem" listed above. A mousetrap was tested by connecting a wheel to the striking arm and then adding different masses to a string wrapped around the wheel as shown in the diagram below. The data in the table shown was collected. A) Create a spreadsheet containing the table of information provided. You do not need to include the diagram B) Form a graph of Mass versus Angle. Angle is the independent variable C) Add linear, exponential, and power trendlines to the same graph Show the equation and R for each trend line. Which trendline fits best? Use linear log scales to match the best fit trendline. Use the appropriate lincar/log scales based on the trendline that you choose D) Display the best equation E) Use the trendline equation found above in an Excel formula to calculate the predicted mass for angles 30, 90, 120, and 180 degrees. Put these four results in a separate table. Show a sample Excel formula below the table. (Answer to check your results: Mess = 745g for Angle 180 degrees) Table 5: Mass Versus Angle for a Mousetrap Angle, A Mass, m (degrees) ( 2 200 15 250 25 300 39 350 54 400 70 450 105 500 115 550 128 600 147 650 167 700 1001 words English (United States D Focus