

Answered step by step
Verified Expert Solution
Question
1 Approved Answer
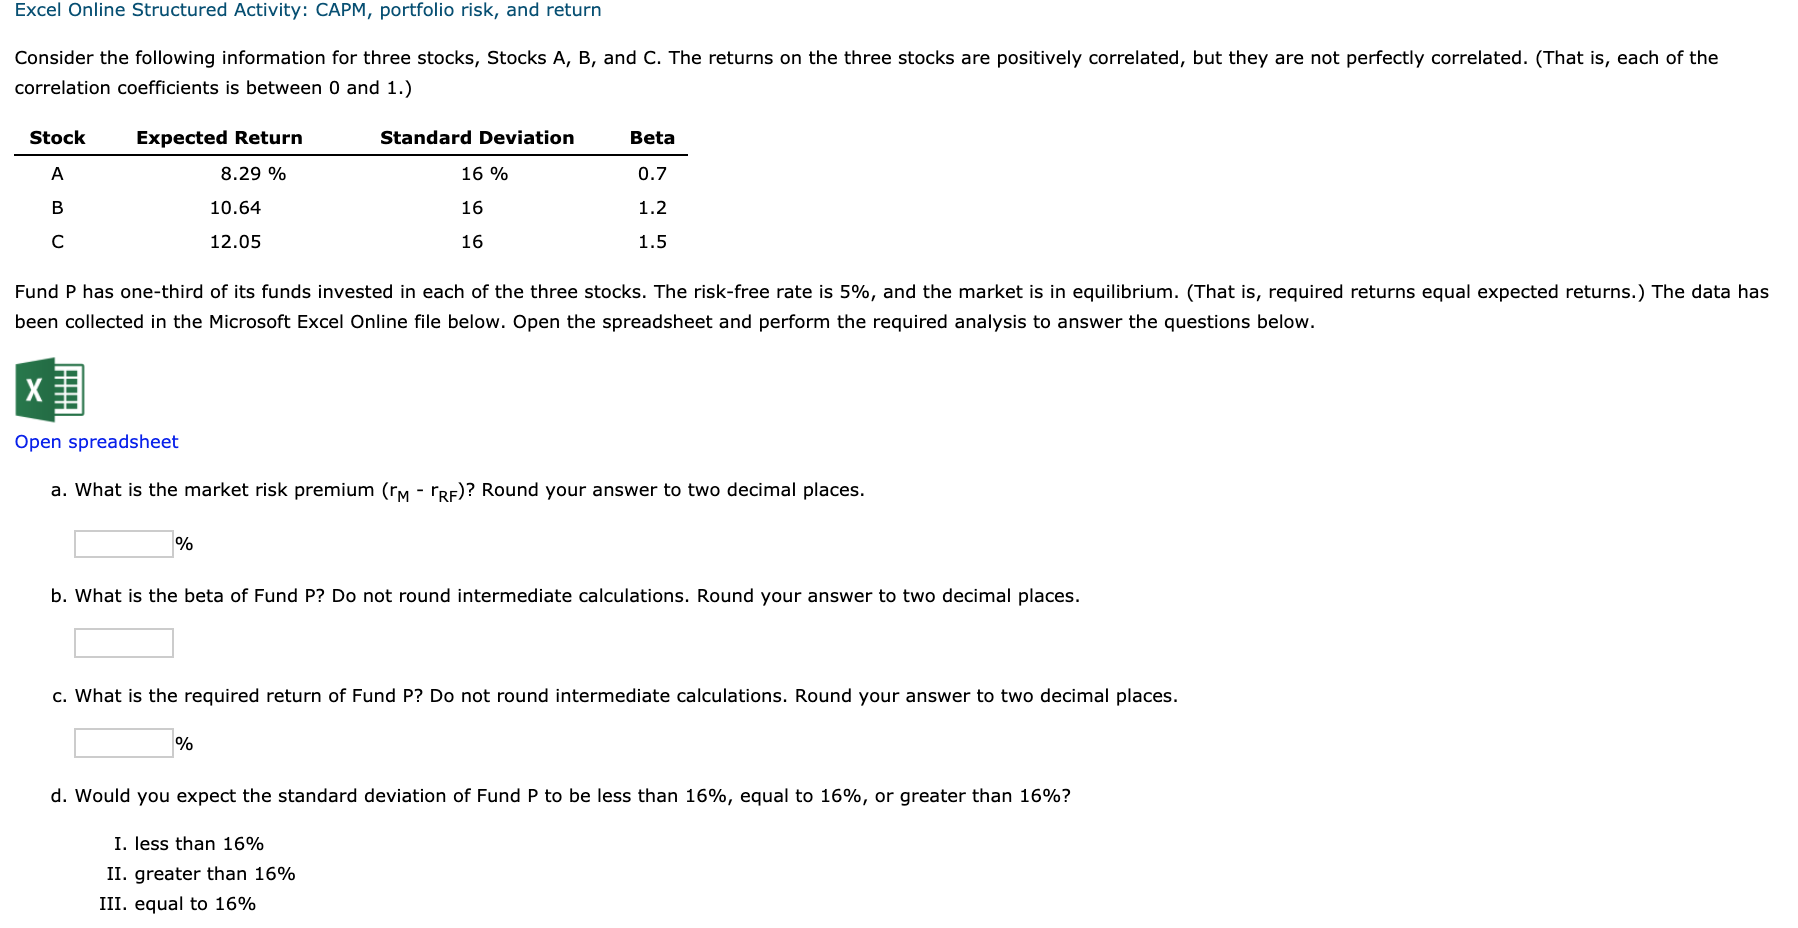
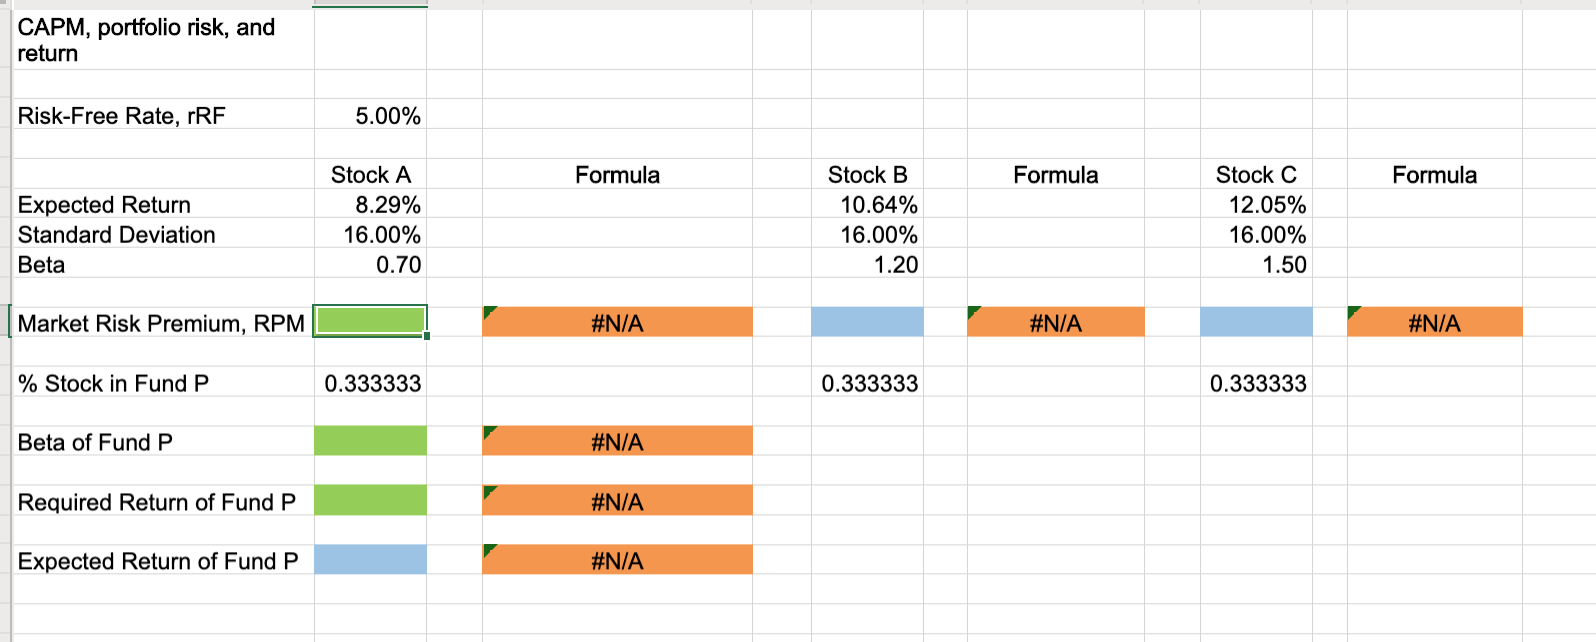
Excel Online Structured Activity: CAPM, portfolio risk, and return Consider the following information for three stocks, Stocks A, B, and C. The returns on the
Step by Step Solution
There are 3 Steps involved in it
Step: 1

Get Instant Access to Expert-Tailored Solutions
See step-by-step solutions with expert insights and AI powered tools for academic success
Step: 2

Step: 3
Ace Your Homework with AI
Get the answers you need in no time with our AI-driven, step-by-step assistance
Get Started
Forecasting And Predictive Analytics With Forecast X
Authors: Barry Keating, J. Holton Wilson, John Solutions Inc.
7th International Edition
1260085236, 9781260085235