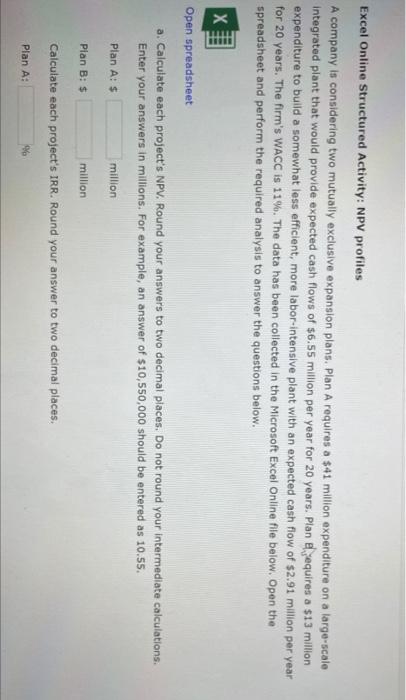
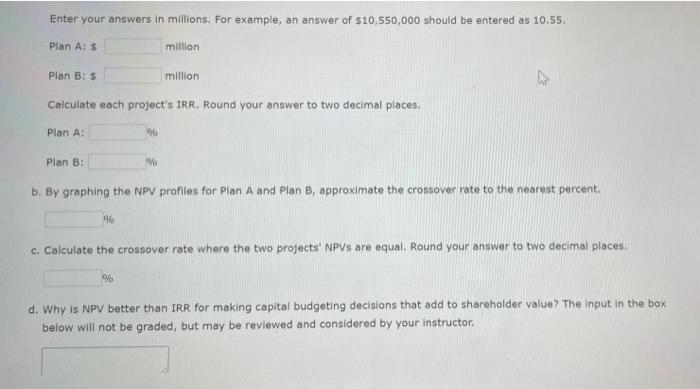
Excel Online Structured Activity: NPV profiles A company is considering two mutually exclusive expansion plans. Plan A requires a $41 million expenditure on a large-scale integrated plant that would provide expected cash flows of $6.55 million per year for 20 years. Plan el equires a $13 million expenditure to build a somewhat less efficient, more labor-intensive plant with an expected cash flow of $2.91 million per year for 20 years. The firm's WACC is 11%. The data has been collected in the Microsoft Excel Online file below. Open the spreadsheet and perform the required analysis to answer the questions below. X HATHI Open spreadsheet a. Calculate each project's NPV. Round your answers to two decimal places. Do not round your intermediate calculations. Enter your answers in millions. For example, an answer of $10,550,000 should be entered as 10.55. Plan A: $ million Plan B: $ million Calculate each project's IRR. Round your answer to two decimal places. Plan A: Enter your answers in millions. For example, an answer of $10,550,000 should be entered as 10.55. Plan A: $ million Plan B : $ million Calculate each project's IRR. Round your answer to two decimal places. Plan A: % Plan B : b. By graphing the NPV profiles for Plan A and Plan B, approximate the crossover rate to the nearest percent. % c. Calculate the crossover rate where the two projects' NPVs are equal. Round your answer to two decimal places % d. Why Is NPV better than IRR for making capital budgeting decisions that add to shareholder value? The input in the box below will not be graded, but may be reviewed and considered by your instructor. VU NI 1 GO DES 5241 SI 15 58 11 NPV AC 17 NPVP Chico 1000 WO 201 NPV Profiles 10 w Casino 1 DOLI 1658 15555555 5616 986 VE 16 16T 0 1216 21 16 29 1001 090 Ford VY CR