

Question
Excel picture with data attached. Please show relevant work. 1. Using the Gordon formula, find the WACC for Colgate-Palmolive Company at the end of 2010.
Excel picture with data attached. Please show relevant work.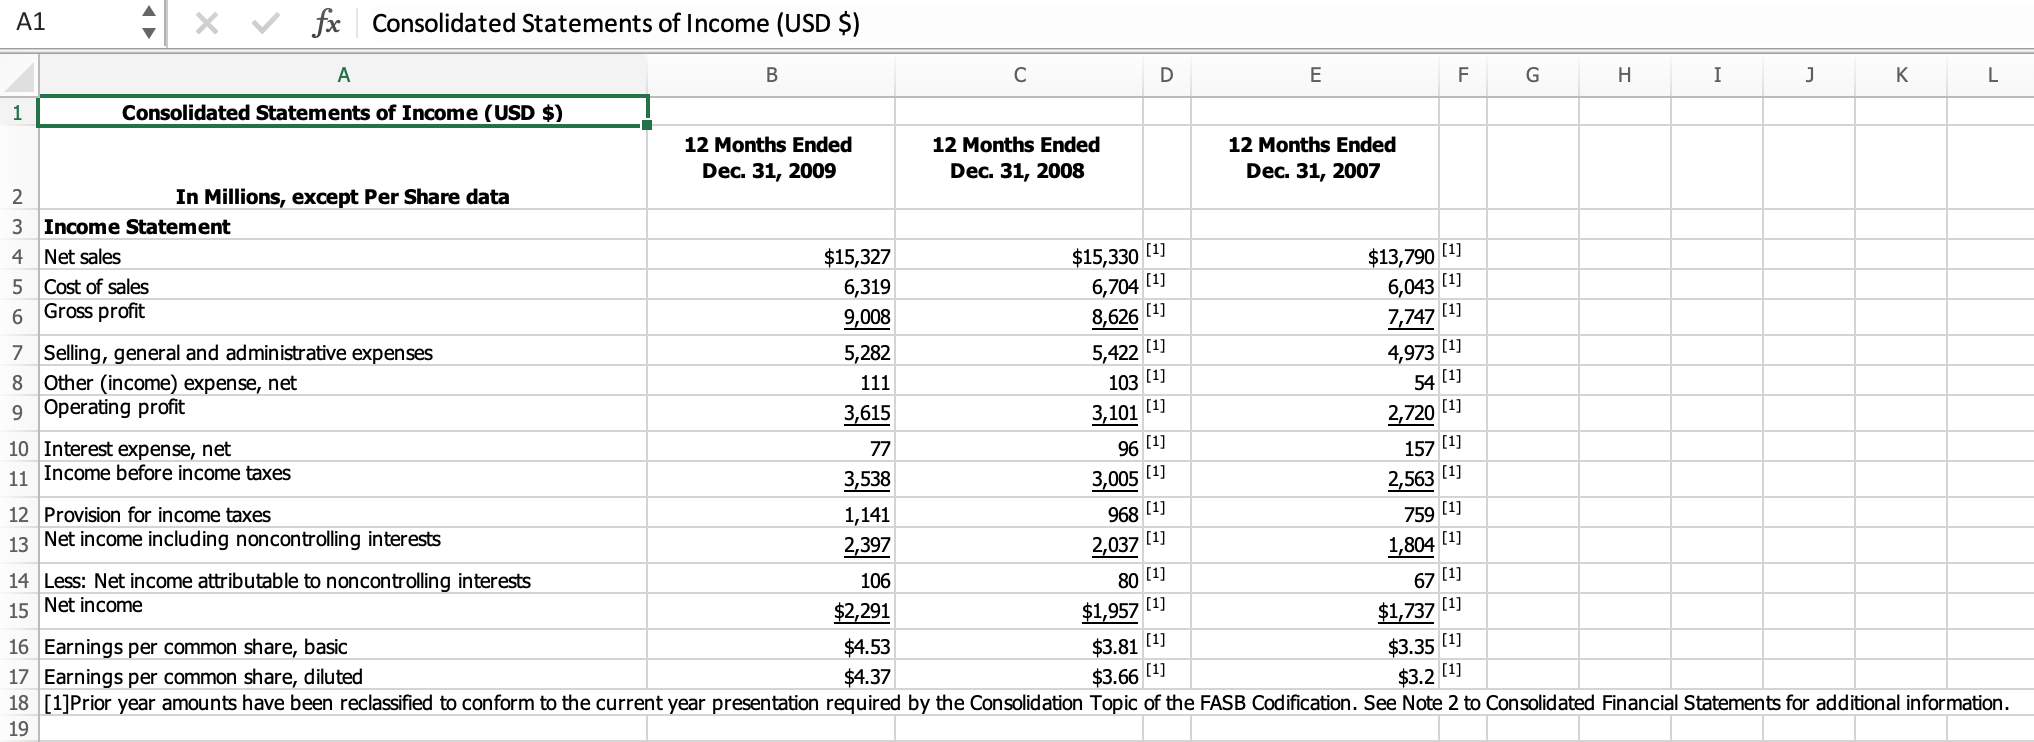
1. Using the Gordon formula, find the WACC for Colgate-Palmolive Company at the end of 2010. Make any needed assumptions at your discretion.
2. Using the CF to equity method, find the WACC for Colgate-PalmoliveCompany at the end of 2010. Make any needed assumptions at your discretion.
3. Using the CAPM, find the WACC for Colgate-Palmolive Company at the end of 2010. Make any needed assumptions at your discretion.
A1 fx Consolidated Statements of Income (USD $) A B D E F G H I J K L 1 Consolidated Statements of Income (USD $) $15,330 (1) 6,704 (1) 8,626 [1] $13,790 [1] 6,043 [1] 7,747 [1] 4,973 (1) 103 (1) 3,101 [1] 12 Months Ended 12 Months Ended 12 Months Ended Dec. 31, 2009 Dec. 31, 2008 2 Dec. 31, 2007 In Millions, except Per Share data 3 Income Statement 4 Net sales $15,327 5 Cost of sales 6,319 6 Gross profit 9,008 7 Selling, general and administrative expenses 5,282 [1] 5,422 8 Other (income) expense, net 111 9 Operating profit 54 [1] 3,615 10 Interest expense, net 77 11 Income before income taxes 3,538 3,005 [1] 12 Provision for income taxes 1,141 968 [1] 13 Net income including noncontrolling interests 2,397 2,037 [1] 14 Less: Net income attributable to noncontrolling interests 106 67 [1] 15 Net income $2,291 $1,957 [1] $1,737 16 Earnings per common share, basic $4.53 17 Earnings per common share, diluted $4.37 18 [1]Prior year amounts have been reclassified to conform to the current year presentation required by the Consolidation Topic of the FASB Codification. See Note 2 to Consolidated Financial Statements for additional information. 19 96 (1) 2,720 [1] 157 [1] 2,563 [1] 759 [1] 1,804 (1) 80 (1) $3.81 [1] $3.66 [1] $3.35 [1] $3.2 [1] A1 fx Consolidated Statements of Income (USD $) A B D E F G H I J K L 1 Consolidated Statements of Income (USD $) $15,330 (1) 6,704 (1) 8,626 [1] $13,790 [1] 6,043 [1] 7,747 [1] 4,973 (1) 103 (1) 3,101 [1] 12 Months Ended 12 Months Ended 12 Months Ended Dec. 31, 2009 Dec. 31, 2008 2 Dec. 31, 2007 In Millions, except Per Share data 3 Income Statement 4 Net sales $15,327 5 Cost of sales 6,319 6 Gross profit 9,008 7 Selling, general and administrative expenses 5,282 [1] 5,422 8 Other (income) expense, net 111 9 Operating profit 54 [1] 3,615 10 Interest expense, net 77 11 Income before income taxes 3,538 3,005 [1] 12 Provision for income taxes 1,141 968 [1] 13 Net income including noncontrolling interests 2,397 2,037 [1] 14 Less: Net income attributable to noncontrolling interests 106 67 [1] 15 Net income $2,291 $1,957 [1] $1,737 16 Earnings per common share, basic $4.53 17 Earnings per common share, diluted $4.37 18 [1]Prior year amounts have been reclassified to conform to the current year presentation required by the Consolidation Topic of the FASB Codification. See Note 2 to Consolidated Financial Statements for additional information. 19 96 (1) 2,720 [1] 157 [1] 2,563 [1] 759 [1] 1,804 (1) 80 (1) $3.81 [1] $3.66 [1] $3.35 [1] $3.2 [1]Step by Step Solution
There are 3 Steps involved in it
Step: 1

Get Instant Access to Expert-Tailored Solutions
See step-by-step solutions with expert insights and AI powered tools for academic success
Step: 2

Step: 3
Ace Your Homework with AI
Get the answers you need in no time with our AI-driven, step-by-step assistance
Get Started
Household Finance Adrift In A Sea Of Red Ink Palgrave Macmillan Studies In Banking And Financial Institutions
Authors: D. Chorafas
1st Edition
1137299444, 1137299452, 9781137299451