

Answered step by step
Verified Expert Solution
Question
1 Approved Answer
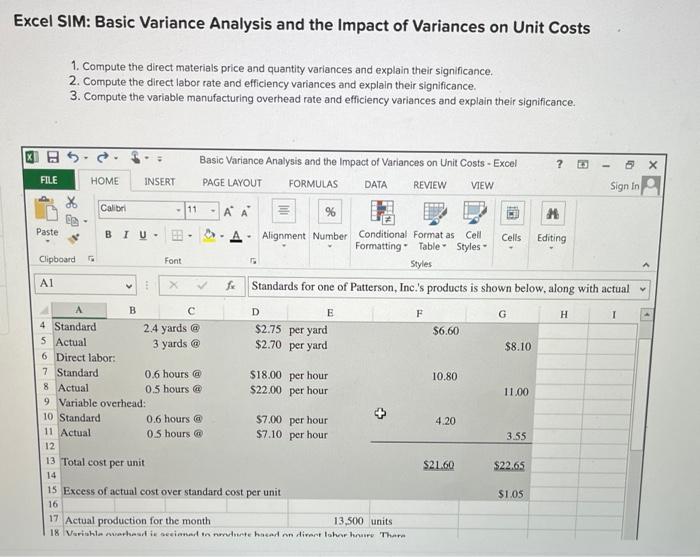
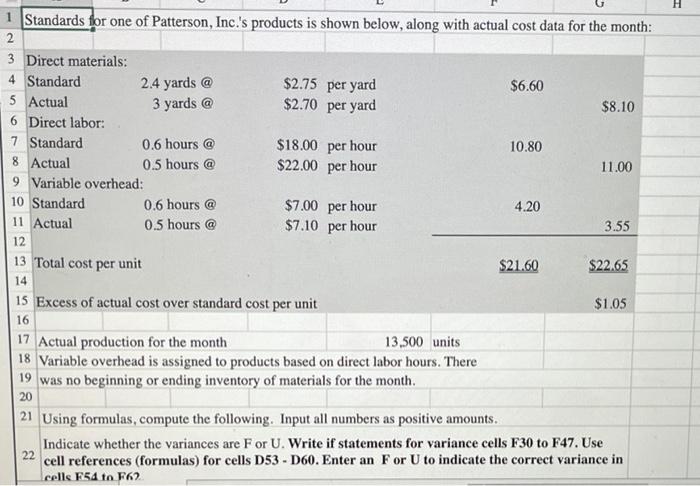
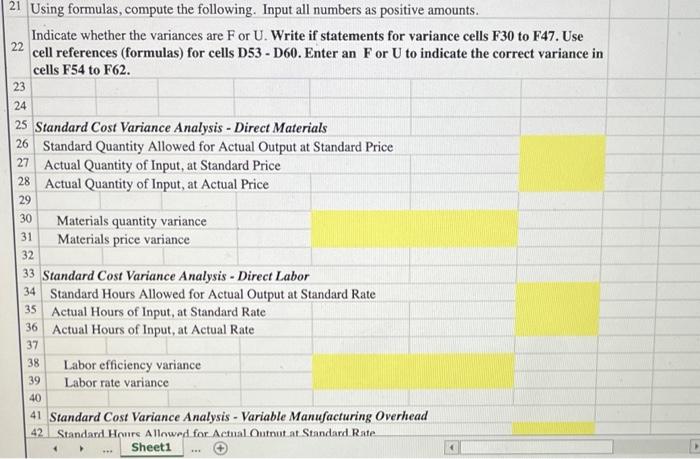
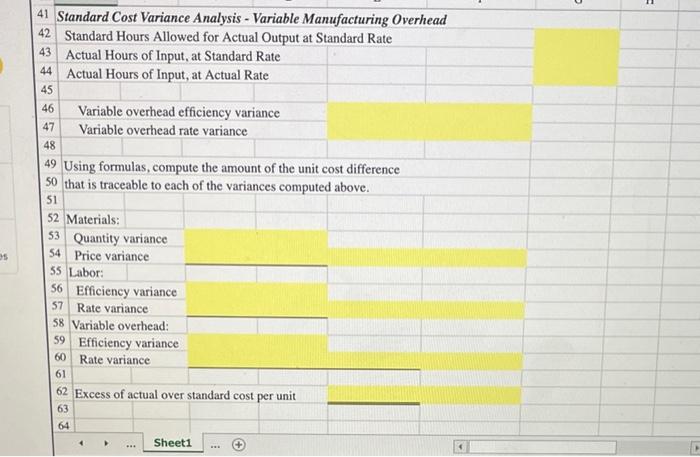
Excel SIM: Basic Variance Analysis and the Impact of Variances on Unit Costs 1. Compute the direct materials price and quantity variances and explain their
Step by Step Solution
There are 3 Steps involved in it
Step: 1

Get Instant Access to Expert-Tailored Solutions
See step-by-step solutions with expert insights and AI powered tools for academic success
Step: 2

Step: 3
Ace Your Homework with AI
Get the answers you need in no time with our AI-driven, step-by-step assistance
Get Started
Financial Accounting Objective Questions And Explanations
Authors: Irvin N. Gleim
6th Edition
0917537718, 978-0917537714