Excel solutions only. Please show formulas. Do not use solver.
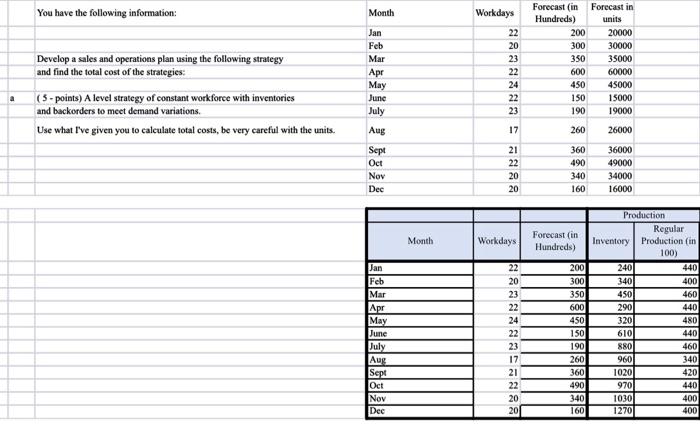
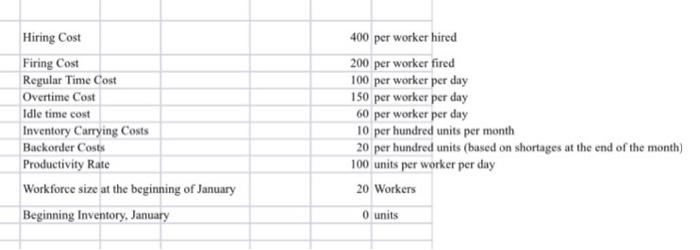
You have the following information: Month Develop a sales and operations plan using the following strategy and find the total cost of the strategies: (5-points) A level strategy of constant workforce with inventories and backorders to meet demand variations. Use what I've given you to calculate total costs, be very careful with the units. Jan Feb Mar Apr May June July Workdays 22 20 23 22 24 22 23 Forecast (in Forecast in Hundreds) units 200 20000 300 30000 350 35000 600 60000 450 45000 150 15000 190 19000 Aug 260 26000 Sept Oct Nov Dec 21 22 20 20 360 490 340 160 36000 49000 34000 16000 Month Workdays Forecast (in Hundreds) Jan Feb Mar Apr May June July Aug Sept Oct Nov Dec 22 20 23 22 24 22 23 17 21 22 20 20 200 300 350 600 450 150 190 260 360 490 340 160 Production Regular Inventory Production (in 100) 240 440 340 400 450 460 290 440 320 480 610 440 880 460 960 340 1020 420 970 440 1030 400 12700 400 Hiring Cost Firing Cost Regular Time Cost Overtime Cost Idle time cost Inventory Carrying Costs Backorder Costs Productivity Rate Workforce size at the beginning of January Beginning Inventory, January 400 per worker hired 200 per worker fired 100 per worker per day 150 per worker per day 60 per worker per day 10 per hundred units per month 20 per hundred units (based on shortages at the end of the month) 100 units per worker per day 20 Workers 0 units You have the following information: Month Develop a sales and operations plan using the following strategy and find the total cost of the strategies: (5-points) A level strategy of constant workforce with inventories and backorders to meet demand variations. Use what I've given you to calculate total costs, be very careful with the units. Jan Feb Mar Apr May June July Workdays 22 20 23 22 24 22 23 Forecast (in Forecast in Hundreds) units 200 20000 300 30000 350 35000 600 60000 450 45000 150 15000 190 19000 Aug 260 26000 Sept Oct Nov Dec 21 22 20 20 360 490 340 160 36000 49000 34000 16000 Month Workdays Forecast (in Hundreds) Jan Feb Mar Apr May June July Aug Sept Oct Nov Dec 22 20 23 22 24 22 23 17 21 22 20 20 200 300 350 600 450 150 190 260 360 490 340 160 Production Regular Inventory Production (in 100) 240 440 340 400 450 460 290 440 320 480 610 440 880 460 960 340 1020 420 970 440 1030 400 12700 400 Hiring Cost Firing Cost Regular Time Cost Overtime Cost Idle time cost Inventory Carrying Costs Backorder Costs Productivity Rate Workforce size at the beginning of January Beginning Inventory, January 400 per worker hired 200 per worker fired 100 per worker per day 150 per worker per day 60 per worker per day 10 per hundred units per month 20 per hundred units (based on shortages at the end of the month) 100 units per worker per day 20 Workers 0 units