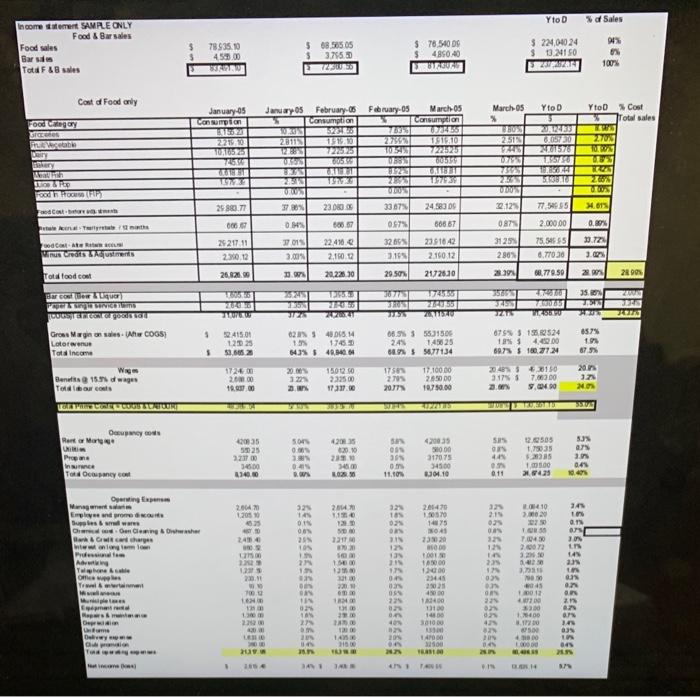
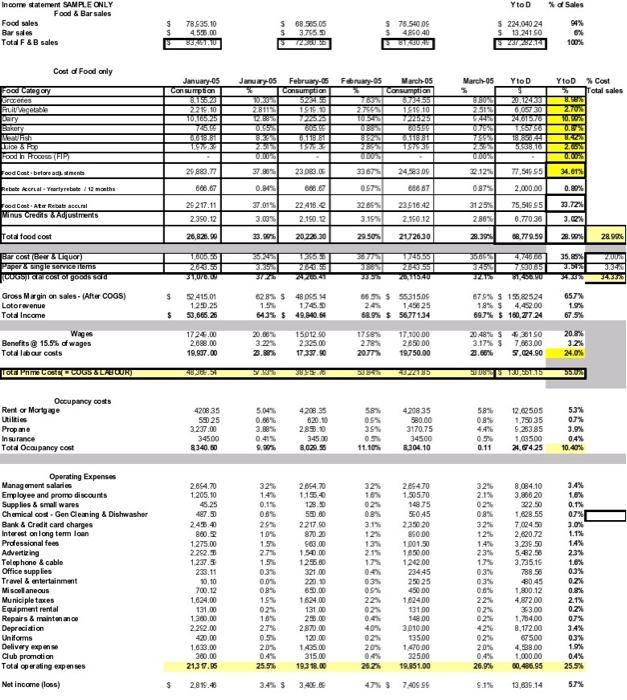
Excel/World Analysis of Data Using the provided Income Statement worksheet and create a one-page analysis of what the data presented shows. Address the following questions in your analysis: What data is provided? What does the data show us? Can you identify any trends? Is there any data that could have been added to make a stronger report? Do you have any recommendations to the business owners? What did you learn from this activity? Create a APA cover page with a header and put your analysis on the second page. No table of contents is necessary or reference page. Yton % Sales M Income met SAMPLE ONLY Food & Barsales Food sales Baris Totd F&B 78935.00 450.00 5 68.56505 3.755.0 7203 3 7 0 DU 4850:40 BWAND $ $ 224,04024 $ 13210 2009AN Cost of Food only Yto D January 05 Consumption Marchos % ES ISABEL Food gory SO Electable Per ERANT OT BRACION BAU January 05 February 05 February 05 March 05 Consumption Consumption 091 28115 1-10 11.10 72225 TUESIT 72525 001 US 0.1 US 210T 2 OVO BASIN Ytob Cost Total sales TS 2700 T. LAS HAU COM INZEL ISRZ 70ST 22505 We IR Food FTP 07 BASES AZ . 25880.77 WONTEZ 33673 24583 22.12 FC 77.5885 .67 37.80% D. 606 80667 07 666 67 087% 0.89% 2421711 230 12 CARER Minus Chats Adjustments 17015 3.004 22.410. 2.150.22 32805 3.105 231642 2.160.12 2.000.00 75.5555 6.710.30 3125 230 2.72 3. Total food cost 26.821 2. 20.226.10 20.SON 21726.30 239 68.779.50 22 28901 153 20000 Barcelo POISIRS TUESERCICIOS . 752151 1359 12 735 051 2204T 751 LE AREA ARS 35.0 TUS 20 TES 707751 T7 JOSE ZRUSU 7135 ZU 06.53 5531506 245 145625 $ 0.77134 $ Gros Maginonsas ACOGS) Lotore Tot Income 241501 12025 59.5658 02034306514 1. 1745.0 64340,000 675 51524 14.000 89.95 $10.27.24 857 1.9 873 5 20 20.00 1501250 2325.00 1750 27 2017 2000 18.07.00 17.100.00 245000 10.750.00 20:4825 426150 3173 7.63.00 2. 9.00 VE 20.00 Benetta 159 wages |Taale als| PRECOCOOL TUNTURI son Onycos Rurt Morg | Pro Ince TO 2003 2010 28 3. a. 2035 5025 22000 3600 140.00 000 Cosa SEOSES SECES OR 44% WE VE 3 . 11.10 317075 345.00 04.10 VO 100 1424 W SOT 0.11 OL POR 2004 2010 32 TAN ON 32 105 02 ON SO 2014 1.1 73 SD 22110 VE SIE SCO WO 52 145 10 an 05 2.0 NO . 241 Manager Emple and produit Dus we were Dan mingisha Bar & G ha wwwtong taman Pro A when we Om wes www 283 NIE SEE NE un 205410 1570 14075 NA 2320 NO 100 100 2344 2023 45000 400 450 2.10072 3200 1 2 ME 2 1 1 10 30 220 w SEE VE VO ve WD WE 20 w re 04 HE BON SP MO ON 22 DO 200 10:13 30 1400 1720 50 O w VE we BE 40 News De Une De G 1300 2 20 LES 381000 4 14 20 TADO OL VE Ne V SPO DOST 04 2 TOR O VEN BAN WE SI BH w YtoD % of Sales Income statement SAMPLE ONLY Food & Barsales Food sales Bar sales Totd F&B sales 78.935.10 4.53,00 BUNU 68.55.05 37559 75.54000 $4960.40 800 224,040 24 $ 1324150 94% 6% 100% Cost of Food only Marel05 January-05 Consumption Yto D Yton Cost Total sales 8.983 2270 20.12433 Foactigery Sroceries Puiu Vegetable Pary Bakery Wh TIDAROO Food h HOCO (FIP) 22101 10.625 761 US January 05 February 05 February March05 Consumption 3 Consumption 1383 281191 151.0 1919.10 ST TUESIST 0.5 UOST BU ORI 152071 15975930 US WUST 37.86% 23.00 33673 245306 0.99 608. 888 87 AT 2.70 0755 1:55750 18 25231 538.10 1972 26 WOOD 34.01% Food Costbrorenent 22.12 29.883.77 666.67 T7.54655 2,000.00 Retete Yartyretle 12 months 0.87 0.90% 33.72% ood Cont Ater etter Wins Credits Adjustments 26 217.11 2.390.12 3701 3.00 22.415.2 2.190.2 32.86% 3.1% 23.516.42 2.950.12 3125% 2-30% 75.51695 0.77030 3.02 Total food cost 26,820.90 33.90% 20.226.30 29.50 21726.30 22.30 68.779.59 28.90% 28 9006 Bar cost (Beer Liquor Paper & single services CUISITE TOUS 23.30 3100 139611 2401 2623551 ZAVOU 4.740.00 78305 35.85% 2.51 2013 3:30 345 $ Gross Margin on sales - (Alter COGS) Lotoravenue Total Income 52415.01 120.25 50.666.28 628% 54805 1.54 1760 643% $ 49.840.6 665 $ 55,315.05 24% 1.45825 68.9% $ 56,771.34 87% $ 158,82524 18% $ 4.42.00 69.7% $180.77.24 657% 1.9% 67.5% $ Wages Benefits @ 15.5% of wages Total labour costs o Prime COCOGS LICOR 1724.00 2688.00 19.037.00 20.00 3.22 23. 150 12.50 2325.00 17337.90 1758% 2783 2077 17.900.00 2650 00 18.750,00 20.48% $ 438150 3.17% $ 7.063.00 2.66% 5.024.90 20.9% 3.2% 24.0% 40360 033828.6 50 585 Occupancy costs Rent or Mortgage Utilities Prope Insurance Total Ocalpancy cost 420835 550 25 3.237.00 34500 8340.00 5.04% 0.66% 3.88% 0.45 9.90 420835 620.10 283.0 345.00 8.02 58% oss 35 420835 50.00 3170.75 34500 8304.10 0.8% 44% 09 0.11 12.505 1.750 35 9 28385 1.09500 24.64.25 5.3% 07% 3.9% 04% 10.40% 11.10 32 32 1.4% 0.1% 0.8% 295 10% 3.1% Operating Expenses Management salaries Employee and promo discounts Supplies & small wares Chemical cos. Gen Cleaning & Dishwasher Bank & Credit card charges Interest on long term loan Professional fees Advertising Telephone & cable Office supplies Travel & entertainment Miscellaneous Municiple takes Equipment rental Repairs & maintenance Depreciation Uniforms Delivery expense Club promotion Total operating expenses 12% 2654.70 1.205.10 45.25 487.50 243.40 860.2 1.275.00 2282.5 1.237.5 233.11 30.10 700.12 1.624.00 131.00 1.300.00 2.262.00 420.00 1.033.00 200.00 2139.95 2854.70 1.150 1289 59.00 221790 870.20 563.00 1.50.00 125580 321.00 220 2.15 17% 04 035 OS 225 27% 1.5% 0.3% 00% 0.3% 19% 02% 10% 27% 09 20% 0.4% 25.5% 2.86470 1.50570 14875 5045 2350 20 86000 1001.50 165000 120.00 23445 250 25 45000 162400 13100 148.00 3010.00 135.00 1.470.00 325.00 $9.951,00 32% 2.15 02% 08% 32 12% 1.4% 234 1.24 034 0.3% 0.6% 224 02% 02% 42% 02 2.0% 0.4% 26.9% 8.084.10 3.808 20 322.50 1.628.55 7.024.50 2.620.72 3.239.50 5.42.50 3.735.16 788.50 480.45 1.800.12 4,872.00 363.00 1.704.00 8.172.00 87500 4.538.00 1.000.00 60.486.95 34% 1.6% 0.1% 0.7% 3.0% 1.1% 14% 2.3% 1.6% 0.3% 0.2% 0.8% 2.1% 0.2% 07% 34% 0.3% 10% 0.4% 25.5% 162400 13100 25.00 2870.00 120.00 1.435.00 315.00 1938.00 0.6 40% 025 20% 0. 2575 Net income foss) $ 2819.45 47% $ 7.405 96 9.1% 13.606.14 5.7% Using the provided Income Statement worksheet and create a one-page analysis of what the data presented shows. Address the following questions in your analysis: What data is provided? What does the data show us? Can you identify any trends? Is there any data that could have been added to make a stronger report? Do you have any recommendations to the business owners? What did you learn from this activity? Create a APA cover page with a header and put your analysis on the second page. No table of contents is necessary or reference page. Excel/World Analysis of Data Using the provided Income Statement worksheet and create a one-page analysis of what the data presented shows. Address the following questions in your analysis: What data is provided? What does the data show us? Can you identify any trends? Is there any data that could have been added to make a stronger report? Do you have any recommendations to the business owners? What did you learn from this activity? Create a APA cover page with a header and put your analysis on the second page. No table of contents is necessary or reference page. Yton % Sales M Income met SAMPLE ONLY Food & Barsales Food sales Baris Totd F&B 78935.00 450.00 5 68.56505 3.755.0 7203 3 7 0 DU 4850:40 BWAND $ $ 224,04024 $ 13210 2009AN Cost of Food only Yto D January 05 Consumption Marchos % ES ISABEL Food gory SO Electable Per ERANT OT BRACION BAU January 05 February 05 February 05 March 05 Consumption Consumption 091 28115 1-10 11.10 72225 TUESIT 72525 001 US 0.1 US 210T 2 OVO BASIN Ytob Cost Total sales TS 2700 T. LAS HAU COM INZEL ISRZ 70ST 22505 We IR Food FTP 07 BASES AZ . 25880.77 WONTEZ 33673 24583 22.12 FC 77.5885 .67 37.80% D. 606 80667 07 666 67 087% 0.89% 2421711 230 12 CARER Minus Chats Adjustments 17015 3.004 22.410. 2.150.22 32805 3.105 231642 2.160.12 2.000.00 75.5555 6.710.30 3125 230 2.72 3. Total food cost 26.821 2. 20.226.10 20.SON 21726.30 239 68.779.50 22 28901 153 20000 Barcelo POISIRS TUESERCICIOS . 752151 1359 12 735 051 2204T 751 LE AREA ARS 35.0 TUS 20 TES 707751 T7 JOSE ZRUSU 7135 ZU 06.53 5531506 245 145625 $ 0.77134 $ Gros Maginonsas ACOGS) Lotore Tot Income 241501 12025 59.5658 02034306514 1. 1745.0 64340,000 675 51524 14.000 89.95 $10.27.24 857 1.9 873 5 20 20.00 1501250 2325.00 1750 27 2017 2000 18.07.00 17.100.00 245000 10.750.00 20:4825 426150 3173 7.63.00 2. 9.00 VE 20.00 Benetta 159 wages |Taale als| PRECOCOOL TUNTURI son Onycos Rurt Morg | Pro Ince TO 2003 2010 28 3. a. 2035 5025 22000 3600 140.00 000 Cosa SEOSES SECES OR 44% WE VE 3 . 11.10 317075 345.00 04.10 VO 100 1424 W SOT 0.11 OL POR 2004 2010 32 TAN ON 32 105 02 ON SO 2014 1.1 73 SD 22110 VE SIE SCO WO 52 145 10 an 05 2.0 NO . 241 Manager Emple and produit Dus we were Dan mingisha Bar & G ha wwwtong taman Pro A when we Om wes www 283 NIE SEE NE un 205410 1570 14075 NA 2320 NO 100 100 2344 2023 45000 400 450 2.10072 3200 1 2 ME 2 1 1 10 30 220 w SEE VE VO ve WD WE 20 w re 04 HE BON SP MO ON 22 DO 200 10:13 30 1400 1720 50 O w VE we BE 40 News De Une De G 1300 2 20 LES 381000 4 14 20 TADO OL VE Ne V SPO DOST 04 2 TOR O VEN BAN WE SI BH w YtoD % of Sales Income statement SAMPLE ONLY Food & Barsales Food sales Bar sales Totd F&B sales 78.935.10 4.53,00 BUNU 68.55.05 37559 75.54000 $4960.40 800 224,040 24 $ 1324150 94% 6% 100% Cost of Food only Marel05 January-05 Consumption Yto D Yton Cost Total sales 8.983 2270 20.12433 Foactigery Sroceries Puiu Vegetable Pary Bakery Wh TIDAROO Food h HOCO (FIP) 22101 10.625 761 US January 05 February 05 February March05 Consumption 3 Consumption 1383 281191 151.0 1919.10 ST TUESIST 0.5 UOST BU ORI 152071 15975930 US WUST 37.86% 23.00 33673 245306 0.99 608. 888 87 AT 2.70 0755 1:55750 18 25231 538.10 1972 26 WOOD 34.01% Food Costbrorenent 22.12 29.883.77 666.67 T7.54655 2,000.00 Retete Yartyretle 12 months 0.87 0.90% 33.72% ood Cont Ater etter Wins Credits Adjustments 26 217.11 2.390.12 3701 3.00 22.415.2 2.190.2 32.86% 3.1% 23.516.42 2.950.12 3125% 2-30% 75.51695 0.77030 3.02 Total food cost 26,820.90 33.90% 20.226.30 29.50 21726.30 22.30 68.779.59 28.90% 28 9006 Bar cost (Beer Liquor Paper & single services CUISITE TOUS 23.30 3100 139611 2401 2623551 ZAVOU 4.740.00 78305 35.85% 2.51 2013 3:30 345 $ Gross Margin on sales - (Alter COGS) Lotoravenue Total Income 52415.01 120.25 50.666.28 628% 54805 1.54 1760 643% $ 49.840.6 665 $ 55,315.05 24% 1.45825 68.9% $ 56,771.34 87% $ 158,82524 18% $ 4.42.00 69.7% $180.77.24 657% 1.9% 67.5% $ Wages Benefits @ 15.5% of wages Total labour costs o Prime COCOGS LICOR 1724.00 2688.00 19.037.00 20.00 3.22 23. 150 12.50 2325.00 17337.90 1758% 2783 2077 17.900.00 2650 00 18.750,00 20.48% $ 438150 3.17% $ 7.063.00 2.66% 5.024.90 20.9% 3.2% 24.0% 40360 033828.6 50 585 Occupancy costs Rent or Mortgage Utilities Prope Insurance Total Ocalpancy cost 420835 550 25 3.237.00 34500 8340.00 5.04% 0.66% 3.88% 0.45 9.90 420835 620.10 283.0 345.00 8.02 58% oss 35 420835 50.00 3170.75 34500 8304.10 0.8% 44% 09 0.11 12.505 1.750 35 9 28385 1.09500 24.64.25 5.3% 07% 3.9% 04% 10.40% 11.10 32 32 1.4% 0.1% 0.8% 295 10% 3.1% Operating Expenses Management salaries Employee and promo discounts Supplies & small wares Chemical cos. Gen Cleaning & Dishwasher Bank & Credit card charges Interest on long term loan Professional fees Advertising Telephone & cable Office supplies Travel & entertainment Miscellaneous Municiple takes Equipment rental Repairs & maintenance Depreciation Uniforms Delivery expense Club promotion Total operating expenses 12% 2654.70 1.205.10 45.25 487.50 243.40 860.2 1.275.00 2282.5 1.237.5 233.11 30.10 700.12 1.624.00 131.00 1.300.00 2.262.00 420.00 1.033.00 200.00 2139.95 2854.70 1.150 1289 59.00 221790 870.20 563.00 1.50.00 125580 321.00 220 2.15 17% 04 035 OS 225 27% 1.5% 0.3% 00% 0.3% 19% 02% 10% 27% 09 20% 0.4% 25.5% 2.86470 1.50570 14875 5045 2350 20 86000 1001.50 165000 120.00 23445 250 25 45000 162400 13100 148.00 3010.00 135.00 1.470.00 325.00 $9.951,00 32% 2.15 02% 08% 32 12% 1.4% 234 1.24 034 0.3% 0.6% 224 02% 02% 42% 02 2.0% 0.4% 26.9% 8.084.10 3.808 20 322.50 1.628.55 7.024.50 2.620.72 3.239.50 5.42.50 3.735.16 788.50 480.45 1.800.12 4,872.00 363.00 1.704.00 8.172.00 87500 4.538.00 1.000.00 60.486.95 34% 1.6% 0.1% 0.7% 3.0% 1.1% 14% 2.3% 1.6% 0.3% 0.2% 0.8% 2.1% 0.2% 07% 34% 0.3% 10% 0.4% 25.5% 162400 13100 25.00 2870.00 120.00 1.435.00 315.00 1938.00 0.6 40% 025 20% 0. 2575 Net income foss) $ 2819.45 47% $ 7.405 96 9.1% 13.606.14 5.7% Using the provided Income Statement worksheet and create a one-page analysis of what the data presented shows. Address the following questions in your analysis: What data is provided? What does the data show us? Can you identify any trends? Is there any data that could have been added to make a stronger report? Do you have any recommendations to the business owners? What did you learn from this activity? Create a APA cover page with a header and put your analysis on the second page. No table of contents is necessary or reference page
