Question
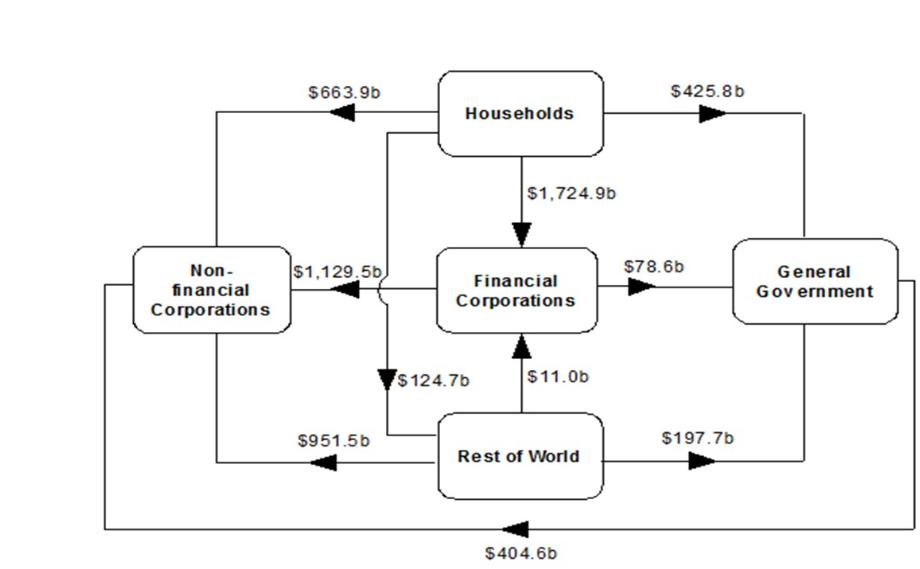
The following chart is taken from the Australian National Accounts: Finance and Wealth , September 2018, published by the Australian Bureau of Statistics (ABS) on
The following chart is taken from the Australian National Accounts: Finance and Wealth, September 2018, published by the Australian Bureau of Statistics (ABS) on December 13th, 2018.

The chart describes the net claims across the five sectors of Australia’s financial system, at the end of September 2018. To help you to interpret the chart, I will interpret one of the figures on it. The $11.0bn figure above the arrow going to Financial Corporations (banks and other institutions) from the Rest of the World indicates that Australian financial corporations owed a net amount of $11.0bn to investors from outside Australia at that point in time
Each sector has four arrows going from it or to it. Arrows going from a sector involve that sector having a net claim on another sector. Arrows going to a sector involve that sector net debt to another sector.
If a sector has net overall claims on other sectors, then the sector has positive net financial assets. If a sector is in net overall debt to other sectors, then the sector has net financial liabilities.
- Excluding the General Government sector, which of the other sectors had net financial assets and which of the other sectors had net financial liabilities, and how big were the net financial assets or net financial liabilities of each of these other sectors?
- An individual household has net financial liabilities of $100,000, and yet net assets of $200,000. Explain precisely how this is possible.
- How is it possible for an individual household to have net financial liabilities, while at the same time the Households sector has net financial assets?
- What were the net financial assets or liabilities for the Australian General Government sector as a whole at the end of September 2018? . What were the net financial assets or liabilities of the non-government sector as a whole (including all four other sectors)? . Explain your answers
- Suppose that at a future point in time the net financial assets or liabilities of the Rest of the World, Non-financial Corporations and Financial corporations remain at their September 2018 values, but the General Government sector has paid off all of its debt. What will be the value of Household sector net financial assets? Explain your answer.
$663.9b $425.8b Households $1,724.9b Non- $1,129.5b $78.6b General Financial financial Gov ernment Corporations Corporation s $ 124.7b $11.0b $951.5b $197.7b Rest of World $404.6b
Step by Step Solution
3.52 Rating (155 Votes )
There are 3 Steps involved in it
Step: 1
Solution of all parts is given below Ans 1 Let us consider sector by sector Households Net assets Net liabilities 6639bn to nonfinancial corporations 4258bn to general government 1247bn to rest of wor...
Get Instant Access to Expert-Tailored Solutions
See step-by-step solutions with expert insights and AI powered tools for academic success
Step: 2

Step: 3

Ace Your Homework with AI
Get the answers you need in no time with our AI-driven, step-by-step assistance
Get Started


