

Answered step by step
Verified Expert Solution
Question
1 Approved Answer
Exel will do, I need help with Excel entries Using the data in the following table, :, calculate the volatility (standard deviation) of a portfolio
Exel will do, I need help with Excel entries
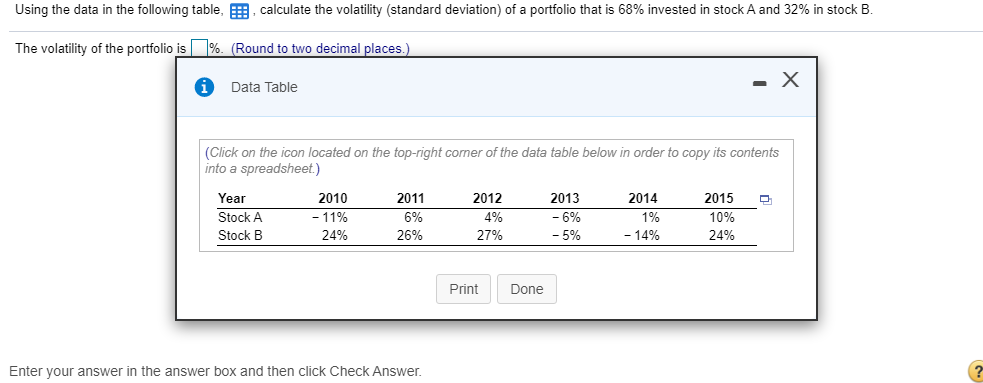
Using the data in the following table, :, calculate the volatility (standard deviation) of a portfolio that is 68% invested in stock A and 32% in stock B. The volatility of the portfolio is %. (Round to two decimal places.) i Data Table (Click on the icon located on the top-right corner of the data table below in order to copy its contents into a spreadsheet.) Year 2010 2011 2012 2013 2014 2015 Stock A - 11% 6% 4% -6% 1% 10% Stock B 26% 27% - 5% - 14% 24% 24% Print Done Enter your answer in the answer box and then click CheckStep by Step Solution
There are 3 Steps involved in it
Step: 1

Get Instant Access to Expert-Tailored Solutions
See step-by-step solutions with expert insights and AI powered tools for academic success
Step: 2

Step: 3
Ace Your Homework with AI
Get the answers you need in no time with our AI-driven, step-by-step assistance
Get Started
Foreign Investment And Spillovers
Authors: Magnus Blomstrom
1st Edition
1138025976,1317685121