

Question: Exercise 1 - Slutsky equation 1. Assume there are two goods, 1 and 2. Illustrate graphically the Slutsky decomposition of a decrease in the price

Exercise 1 - Slutsky equation
1. Assume there are two goods, 1 and 2. Illustrate graphically the Slutsky decomposition of a decrease in the price of good 1 under the assumption that it is a normal good.
2. Assume there are two goods, 1 and2 Illustrate graphically the Hicks decomposition of an increase in the price of good 1 under the assumption that it is an inferior good (but not Giffen). Write down the Slutsky equation for good 1 and give a sign to the income, substitution and total effects.
3. Given that good 1 is inferior, can good 2 also be inferior? (Hint: consider the budget constraint at the optimal consumption point of the utility-maximisation problem, and take the derivative with respect to budget y.)
4. In Exercise 2 from PS3, which pairs of goods would you regard as substitutes and which as complements?
5. In Exercise 2 from PS3, compute the total effect, the income effect and the compensated effect of an own-price change for good 1. Is the Slutsky equation satisfied? Justify your results.
Question: Exercise 2 - Consumer demand with non-linear budger sets Consumers live on bread x and cheese y. ...
Exercise 2 - Consumer demand with non-linear budger sets Consumers live on bread x and cheese y. They face the following pricing schedule. If consumption is below A loaves of bread then each loaf costs $1. If consumption is A or more then the price falls to $ 1 2 (on every loaf and not just those in excess of A). The price of cheese is $1 per unit, regardless of the amount consumed.
1. What is the maximum amount of cheese a consumer with a total budget of M can afford if she buys less than A loaves of bread? And if she buys A or more loaves?
2. Draw the budget constraint for someone with total budget of $10, labelling all relevant slopes and intercepts. Is the budget set convex? Justify your answer.
3. Raul has preferences represented by the function uR(x, y) = min[x; y] and a total budget of $10.
(a) How many loaves would he buy if he paid a constant price of 1 for every loaf of bread, regardless of the total amount of break purchased? (Hint: Draw Raul's indifference map. Then argue that he will optimally choose to consume equal quantities of cheese as bread: x ? = y ? .)
(b) How many loaves would he buy if he paid a constant price of 1/ 2 for every loaf of bread, regardless of the total amount of break purchased? (Hint: follow the same line of argument as in the previous question.)
(c) Hence determine how many loaves Raul will buy subject to the nonlinear constraint described in (2.) if A = 5.
4. Now consider Gabriela with the same budget as Raul, but preferences uG(x, y) = min[2x; y]. How does her demand differ from Raul's when facing the nonlinear constraint described in (2.) if A = 5? Give an intuition for this result.
Exercise 2.
1) The Economy cannot be considered fully employed unless the measured unemployment rate is below 1%. Agree or disagree and explain your answer in a paragraph. What is the current actual u-rate for the US economy as of February Data for 2021?Is this unemployment rate below or above or equal to u-rate at full employment (usually called natural rate of unemployment or NAIRU)? What state of the economy do you consider from this u-rate for Feb 2021 (recession, depression or inflation?) and its sources?
2) A) Why would you expect the inflation rate to accelerate if the actual unemployment rate declined to a level lower than the "full employment" unemployment rate (NAIRU) and remained at that low level for a year or longer? Explain your answer in a few sentences.
.
B) Draw an AS/AD diagram illustrating your answer to part (A) and refer to the current state of the economy of the US to compare in this context. Be sure to label all lines and axes in your diagram clearly.
3) Suppose between Q1, 2020 and Q4, 2020 measured Output in the non- farm business sector increased by 3.6%. During this time period the unemployment rate fell from 4.6% to 3.7% and total hours worked in the nonfarm business sector increased by 3.8%.
What was the % rate of change in labor productivity over this period (Q1 2020 to Q4 2020)? Explain your answer briefly. (Hint: Labor productivity = Y/Labor hours; RGDP growth rate = Labor productivity growth plus and Labor Force Growth rate. No need to use u-rate changes for this question)
4. a. The Federal Government under Biden Administration is about to pass $1.9 Trillion Covid-19 Stimulus Relief Fund to rescue American and plans to distribute by Mar 15, 2021. Under this relief fund, almost 90% all households will receive $1,400 for all individuals filing and $2,800 for all households filing jointly. As part of the package also includes child support allowances for households, small businesses relief fund, covid-19 testing and vaccination roll outs. What would be the overall impact on AD of this third stimulus relief fund to recover the economy from severe recession caused by COVID-19 public health crisis and its effect on change in real GDP? Assume that the Marginal Propensity to Consume (MPC) for all American consumers is 0.8 in February 2021. Estimate the maximum potential increase in real GDP in numerical values based on your knowledge on Keynesian economic model and policy effect, Explain your answer briefly as well . Make sure you use your understanding of the concept of expenditure multiplier in estimating this problem.
4.b. Suppose instead of giving this $1.9 trillion package directly to individuals and small businesses, the legislative branch and the executive branch have decided to provide a tax break of the same amount for all federal tax filers for tax year 2020 that has to be filed by April 15, 2021. In another words, using the same criterion of distribution of $1.9 trillion package described in 4.a above, the government decides to give tax refund during tax filing for year 2020. Given this option, and assuming the same MPC of 0.80, estimate the maximum potential increase in GDP with this option and explain the comparison of your results you have come up with in Q4a above. Hint: Expenditure multiplier versus tax multiplier need to be understood to answer these two questions.
5. Use the macroeconomic data in the table below for the US economy for 2017 and 2018 to answer the questions followed.
Year
NGDP
in '000"
RGDP
In '000'
In 2009 prices
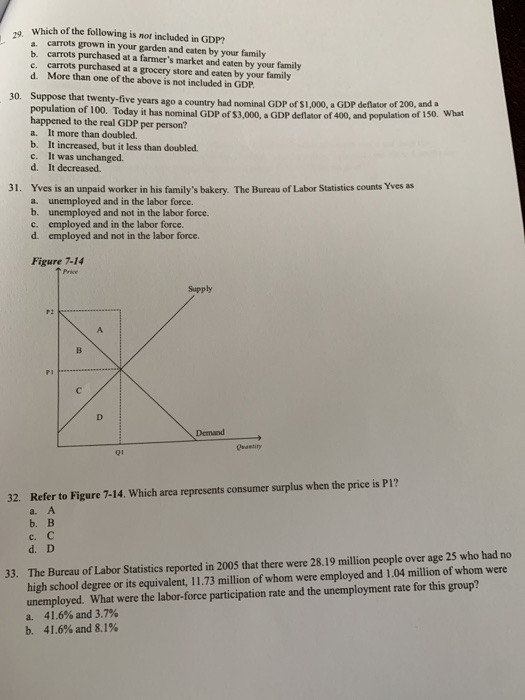
RGDP Growth Rate %
GDPD
Inflation Rate %
u-Rate
%
CPI
Inflation Rate %
2017
19,390.6
17,096.2
-
?
-
4.4
245.12
-
2018*
19,956.8
17,379.7
?
?
?
3.9
250.5
?
* Estimated data from 2017 data, but very close. Sources: www.bea.gov and www.bls.gov
5a. Estimate the values and fill out the boxes with Questions marks.
5b. Based on your estimated values from Q5a, briefly analyze the state of the US economy from year 2017 to 2018 and make a quick forecast for 2019 and 2020.
6. Use the following macroeconomic model structure to answer the questions followed from 6.1 to 6.8. Please note that you must show your work of estimations for these numerical multiple-choice questions for gradable credit. Without showing your works of estimation, your answers won't be credible for take-home exam.
C = 300 + 0.8Yd; C = consumption function; Yd (Y-T) = disposable income
I = 200; I = Investment
G = 400; G = Government expenditure
T = 200; T = Tax revenue
Also assume that Yf = Full employment GDP (Potential GDP) = 5,000
6.1. The equilibrium GDP level (income) is _________. Hint: Ye = C+I+G
a. 2,850
b. 3,700
c. 3,145
d. 3,800
6.2. At the equilibrium level of output, the aggregate consumption level is:
a. 3,100
b. 3,250
c. 3,400
d. 3,625
6.3. At the equilibrium level of output, the aggregate saving level is:
a. 550
b. 450
c. 400
d. 350
6.4. The MPC and MPS for the economy is respectively:
a. 0.9 and 0.1
b. 0.85 and 0.15
c. 0.75 and 0.25
d. 0.80 and 0.20
6.5. The expenditure multiplier for the economy is:
a. 10
b. 8
c. 5
d. 4
6.6. The tax multiplier for the economy is:
a. -3
b. -4
c. 4
d. 5
6.7. Given the value of full employment level of GDP above, the GDP gap is ______
a. 1,200
b.1,300
c. 1,400
d. 1,500
Hint: GDP gap is the difference between full employment (potential GDP) and existing equilibrium GDP)
6.8. The government spending needed to bridge the GDP gap you found in statement 8.7 above would be _____________
Hint: It is also called recessionary or inflationary gap depending on whether the economy is in state of recession or inflation.
a. 400
b. 350
c. 260
d. 250
7. Suppose the Payroll tax reduction for middle-income households has been extended in the amount of $500 billion for the remainder of 2021 to recover from COVID-19 crisis. Assuming the MPC for that income group of households is 0.8 and also assuming that other things stay the same, the increase in GDP under this proposed extension of tax break is expected to increase by (?Y) _______
a. $2,500 billion
b. $2,000 billion
c. $1,000 billion
d. $1,500 billion
Hint: Need to use tax multiplier and keep it mind it is a negative tax.
Part c.
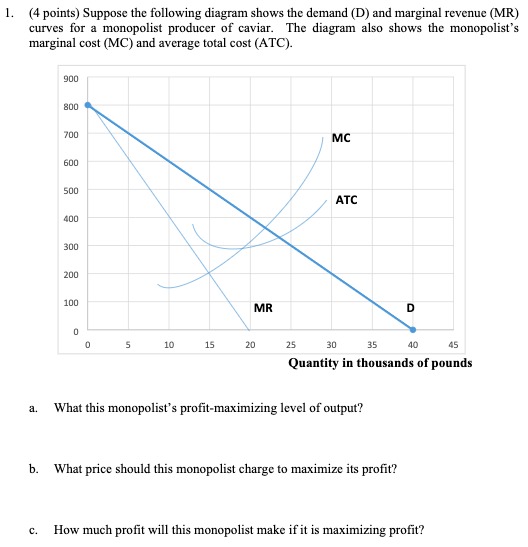

1. (4 points) Suppose the following diagram shows the demand (D) and marginal revenue (MR) curves for a monopolist producer of caviar. The diagram also shows the monopolist's marginal cost (MC) and average total cost (ATC). 900 800 700 MC 600 500 ATC 400 300 200 100 MR D 5 10 15 20 25 30 35 40 45 Quantity in thousands of pounds a. What this monopolist's profit-maximizing level of output? b. What price should this monopolist charge to maximize its profit? C. How much profit will this monopolist make if it is maximizing profit?29. Which of the following is not included in GDP? carrots grown in your garden and eaten by your family C. carrots purchased at a farmer's market and caten by your family carrots purchased at a grocery store and eaten by your family d. More than one of the above is not included in GDP. Suppose that twenty-five years ago a country had nominal GDP of $1,000, a GDP deflator of 200, and a population of 100. Today it has nominal GDP of $3,000, a GDP deflator of 400, and population of 150. What happened to the real GDP per person? It more than doubled. b. It increased, but it less than doubled. c. It was unchanged. d. It decreased. 31. Yves is an unpaid worker in his family's bakery. The Bureau of Labor Statistics counts Yves as a. unemployed and in the labor force. b. unemployed and not in the labor force. C. employed and in the labor force. d. employed and not in the labor force. Figure 7-14 Supply Demand 32. Refer to Figure 7-14. Which arca represents consumer surplus when the price is PI? a. A b. B C. C 33. The Bureau of Labor Statistics reported in 2005 that there were 28.19 million people over age 25 who had no high school degree or its equivalent, 11.73 million of whom were employed and 1.04 million of whom were unemployed. What were the labor-force participation rate and the unemployment rate for this group? a. 41.6% and 3.7% b. 41.6% and 8.1%
Step by Step Solution
There are 3 Steps involved in it

Get step-by-step solutions from verified subject matter experts