

Answered step by step
Verified Expert Solution
Question
1 Approved Answer
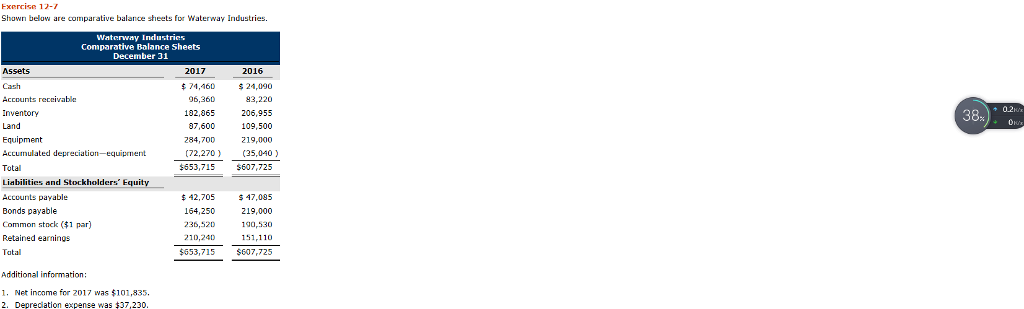
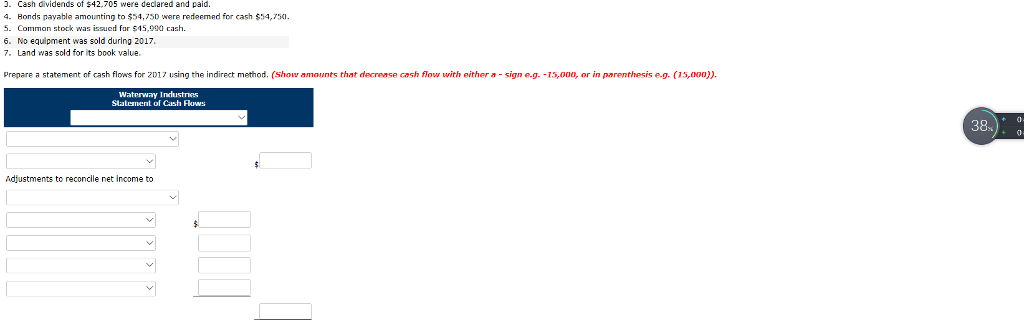
Exercise 12-7 Shown below are comparative balance sheets for Waterway Industries. Industries Comparative Balance Sheets December 31 Assets Cash Accounts receivablk 2017 2016 $74,160 24,090

Step by Step Solution
There are 3 Steps involved in it
Step: 1

Get Instant Access to Expert-Tailored Solutions
See step-by-step solutions with expert insights and AI powered tools for academic success
Step: 2

Step: 3
Ace Your Homework with AI
Get the answers you need in no time with our AI-driven, step-by-step assistance
Get Started
Financial Accounting
Authors: Michael J. Jones
1st Edition
0470058986, 978-0470058985