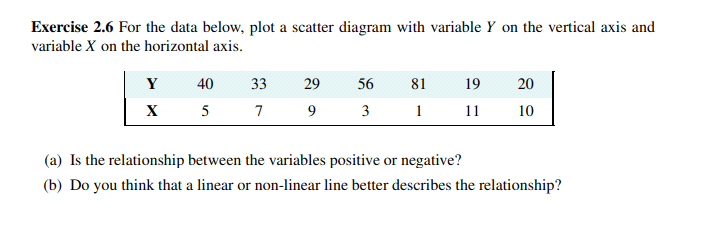


Exercise 1.3 Using the PPF that you have graphed using the data in Exercise 1.2, determine if the following combinations are attainable or not: (X = 3000, Y = 720), (X = 4800, Y = 480). Exercise 1.4 You and your partner are highly efficient people. You can earn $20 per hour in the workplace; your partner can earn $30 per hour. (a) What is the opportunity cost of one hour of leisure for you? (b) What is the opportunity cost of one hour of leisure for your partner? (c) Now consider what a PPF would look like: You can produce/consume two things, leisure and income. Since income buys things you can think of the PPF as having these two *prod- ucts' - leisure and consumption goods/services. So, with leisure on the horizontal axis and income in dollars is on the vertical axis, plot your PPF. You can assume that you have 12Exercise 1.7 Going back to the simple PPF plotted for Exercise 1.1 where each of 100 workers can produce either four cakes or three shirts, suppose a recession reduces demand for the outputs to 220 cakes and 129 shirts. (a) Plot this combination of outputs in the diagram that also shows the PPF. (b) How many workers are needed to produce this output of cakes and shirts? (c) What percentage of the 100 worker labour force is unemployed?Exercise 2.6 For the data below, plot a scatter diagram with variable Y on the vertical axis and variable X on the horizontal axis. Y 40 33 29 56 81 19 20 X 5 7 9 3 11 10 (a) Is the relationship between the variables positive or negative? (b) Do you think that a linear or non-linear line better describes the relationship?Exercise 2.1 An examination of a country's recent international trade flows yields the data in the table below. Year National Income Imports ($b) ($b) 2011 1,500 550 2012 1,575 573 2013 1,701 610 2014 1,531 560 2015 1,638 591 (a) Based on an examination of these data do you think the national income and imports are not related, positively related, or negatively related? (b) Plot each pair of observations in a two-dimensional line diagram to illustrate your view of the import/income relationship. Measure income on the horizontal axis and imports on the vertical axis. This can be done using graph paper or a spreadsheet-cum-graphics software.Exercise 2.2 The average price of a medium coffee at Wakeup Coffee Shop in each of the past ten years is given in the table below. 2005 2006 2007 2008 2009 2010 2011 2012 2013 2014 $1.05 $1.10 $1.14 $1.20 $1.25 $1.25 $1.33 $1.35 $1.45 $1.49 (a) Construct an annual 'coffee price index' for this time period using 2005 as the base year. [Hint: follow the procedure detailed in the chapter - divide each yearly price by the base year price.] (b) Based on your price index, what was the percentage change in the price of a medium coffee from 2005 to 2012? (c) Based on your index, what was the average annual percentage change in the price of coffee from 2005 to 2010? (d) Assuming the inflation rate in this economy was 2% every year, what was the real change in the price of coffee between 2007 and 2008; and between 2009 and 2010? Exercise 2.3 The following table shows hypothetical consumption spending by households and income of households in billions of dollars.EXERCISES FOR CHAPTER 1 Exercise 1.1 An economy has 100 identical workers. Each one can produce four cakes or three shirts, regardless of the number of other individuals producing each good. (a) How many cakes can be produced in this economy when all the workers are cooking? (b) How many shirts can be produced in this economy when all the workers are sewing? (c) On a diagram with cakes on the vertical axis, and shirts on the horizontal axis, join these points with a straight line to form the PPF. (d) Label the inefficient and unattainable regions on the diagram. Exercise 1.2 In the table below are listed a series of points that define an economy's production possibility frontier for goods Y and X. Y 1000 900 800 700 600 500 400 300 200 100 0 X 0 1600 2500 3300 4000 4600 5100 5500 5750 5900 6000 (a) Plot these pairs of points to scale, on graph paper, or with the help of a spreadsheet. (b) Given the shape of this PPF is the economy made up of individuals who are similar or different in their production capabilities? (c) What is the opportunity cost of producing 100 more Y at the combination (X = 5500,Y = 300). (d) Suppose next there is technological change so that at every output level of good Y the econ- omy can produce 20 percent more X. Enter a new row in the table containing the new values, and plot the new PPF.Year Income Consumption 2006 476 434 2007 482 447 2008 495 454 2009 505 471 2010 525 489 2011 539 509 2012 550 530 2013 567 548 (a) Plot the scatter diagram with consumption on the vertical axis and income on the horizontal axis. (b) Fit a line through these points. (c) Does the line indicate that these two variables are related to each other? (d) How would you describe the causal relationship between income and consumption? Exercise 2.4 Using the data from Exercise 2.3, compute the percentage change in consumption and the percentage change in income for each pair of adjoining years between 2006 and 2013. Exercise 2.5 You are told that the relationship between two variables, X and Y, has the form Y = 10 + 2X. By trying different values for X you can obtain the corresponding predicted value for Y (e.g., if X = 3, then Y = 10+2 x 3 = 16). For values of X between 0 and 12, compute the matching value of Y and plot the scatter diagram.hours per day to allocate to either leisure or income. [Hint: the leisure axis will have an intercept of 12 hours. The income intercept will have a dollar value corresponding to where all hours are devoted to work.] (d) Draw the PPF for your partner. Exercise 1.5 Louis and Carrie Anne are students who have set up a summer business in their neighbourhood. They cut lawns and clean cars. Louis is particularly efficient at cutting the grass - he requires one hour to cut a typical lawn, while Carrie Anne needs one and one half hours. In contrast, Carrie Anne can wash a car in a half hour, while Louis requires three quarters of an hour. (a) If they decide to specialize in the tasks, who should cut the grass and who should wash cars? (b) If they each work a twelve hour day, how many lawns can they cut and how many cars can they wash if they each specialize in performing the task where they are most efficient? (c) Illustrate the PPF for each individual where lawns are on the horizontal axis and car washes on the vertical axis, if each individual has twelve hours in a day. Exercise 1.6 Continuing with the same data set, suppose Carrie Anne's productivity improves so that she can now cut grass as efficiently as Louis; that is, she can cut grass in one hour, and can still wash a car in one half of an hour. (a) In a new diagram draw the PPF for each individual. (b) In this case does specialization matter if they are to be as productive as possible as a team? (c) Draw the PPF for the whole economy, labelling the intercepts and the 'kink' point coordi- nates