Answered step by step
Verified Expert Solution
Link Copied!

Question

1 Approved Answer

Exercise 13-05 a-b Suppose the comparative balance sheets of Marin Inc.. are presented here. MARIN INC. Condensed Balance Sheet May 31 ($ in millions) 2020

Exercise 13-05 a-b Suppose the comparative balance sheets of Marin Inc.. are presented here. MARIN INC. Condensed Balance Sheet May 31 ($ in millions) 2020 2019 Assets Current Assets $9,500 $8,880 Property, plant, and equipment (net) 1,950 1,830 Other assets 1,530 1,640 Total assets $12,980 $12,350 Liabilities and Stockholders' Equity Current Liabilities $3,200 $3,300 Long-term liabilities 1,250 1,270 Stockholders equity 8,530 7,780 Total liabilities and stockholders' equity $12,980 $12,350 (a) Prepare a horizontal analysis of the balance sheet data for Marin, using 2019 as a base. (If amount and percentage are a decrease show the numbers as negative, e.g. -55,000, -20% or (55,000), (20%). Round percentages to 1 decimal place, e.g. 12.1%.) MARIN INC. Condensed Balance Sheet May 31 ($ in millions) 2020 2019 Increase (Decrease) Percentage Change from 2019 Assets Current Assets $9,500 $8,880 $enter a dollar amount enter percentages rounded to 1 decimal place % Property, plant, and equipment (net) 1,950 1,830 enter a dollar amount enter percentages rounded to 1 decimal place % Other assets 1,530 1,640 enter a dollar amount enter percentages rounded to 1 decimal place % Total assets $12,980 $12,350 $enter a total amount enter percentages rounded to 1 decimal place % Liabilities and Stockholders' Equity Current Liabilities $3,200 $3,300 $enter a dollar amount enter percentages rounded to 1 decimal place % Long-term liabilities 1,250 1,270 enter a dollar amount enter percentages rounded to 1 decimal place % Stockholders equity 8,530 7,780 enter a dollar amount enter percentages rounded to 1 decimal place % Total liabilities and stockholders' equity $12,980 $12,350 $enter a total amount enter percentages rounded to 1 decimal place %
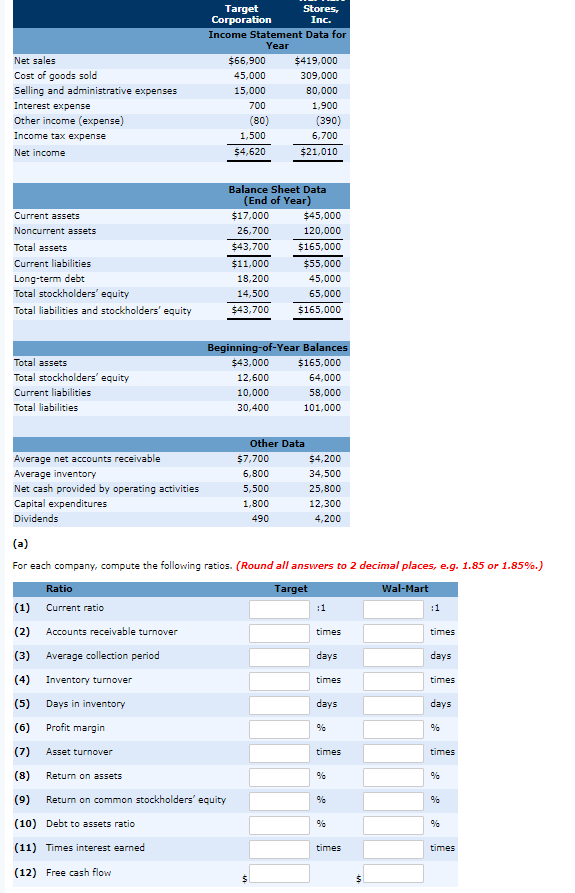
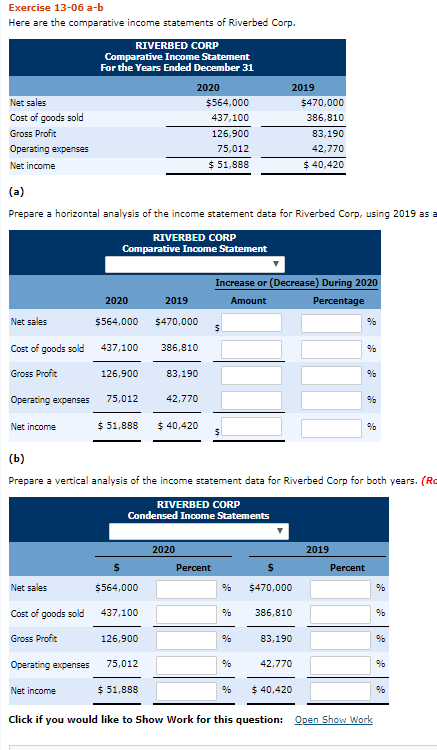
image text in transcribed

image text in transcribed

Net sales Cost of goods sold Selling and administrative expenses Interest expense Other income (expense) Income tax expense Net income Target Stores, Corporation Inc. Income Statement Data for Year $66,900 $419,000 45,000 309,000 15,000 80,000 700 1,900 (390) 1,500 6,700 $4,620 $21,010 (80) Current assets Noncurrent Total assets Current liabilities Long-term debt Total stockholders' equity Total liabilities and stockholders' equity Balance Sheet Data (End of Year) $17,000 $45,000 26,700 120,000 $43,700 $165,000 $11,000 $55,000 18,200 45,000 14,500 65,000 $43,700 $165,000 Total assets Total stockholders' equity Current liabilities Total liabilities Beginning-of-Year Balances $43,000 $165,000 12,600 64,000 10,000 58,000 30,400 101,000 Average net accounts receivable Average inventory Net cash provided by operating activities Capital expenditures Dividends Other Data 57,700 6,800 5,500 1,800 490 $4,200 34,500 25,800 12,300 4,200 (a) For each company, compute the following ratios. (Round all answers to 2 decimal places, e.g. 1.85 or 1.85%.) Ratio Target Wal-Mart (1) Current ratio :1 :1 Accounts receivable turnover times times (2) (3) Average collection period days days (4) Inventory turnover times times (5) Days in inventory days days (6) Profit margin % (7) Asset turnover times times (8) Return on assets 9 % (9) Return on common stockholders' equity 06 % 9 % (10) Debt to assets ratio (11) Times interest earned times times (12) Free cash flow S S Exercise 13-06 a-b Here are the comparative income statements of Riverbed Corp. RIVERBED CORP Comparative Income Statement For the Years Ended December 31 Net sales Cost of goods sold Gross Profit Operating expenses Net income 2020 $564,000 437,100 126,900 75,012 $ 51,888 2019 $470,000 386,810 83,190 42,770 $ 40,420 (a) Prepare a horizontal analysis of the income statement data for Riverbed Corp, using 2019 as a RIVERBED CORP Comparative Income Statement Increase or (Decrease) During 2020 Amount Percentage 2020 2019 Net sales 5564,000 5470,000 % $ Cost of goods sold 437,100 386,810 %6 Gross Profit 126,900 83,190 90 Operating expenses 75,012 42,770 Net income $ 51,888 $ 40,420 % (b) Prepare a vertical analysis of the income statement data for Riverbed Corp for both years. (Ro RIVERBED CORP Condensed Income Statements 2020 2019 $ Percent $ Percent Net sales 5564,000 % S470,000 % Cost of goods sold 437,100 % 386.810 % Gross Profit 126.900 83,190 % Operating expenses 75,012 % 42,770 % Net income $ 51,888 % $ 40,420 % Click if you would like to Show Work for this question: Open Show Work

Step by Step Solution

There are 3 Steps involved in it

Step: 1

blur-text-image

Get Instant Access to Expert-Tailored Solutions

See step-by-step solutions with expert insights and AI powered tools for academic success

Step: 2

blur-text-image

Step: 3

blur-text-image

Ace Your Homework with AI

Get the answers you need in no time with our AI-driven, step-by-step assistance

Get Started

Recommended Textbook for

Japanese Management Accounting A World Class Approach To Profit Management

Authors: Michiharu Sakurai, Yasuhiro Monden

1st Edition

091529950X, 978-0915299508

More Books

Students also viewed these Accounting questions