

Answered step by step
Verified Expert Solution
Question
1 Approved Answer
Exercise 13-9 Risk and capital structure analysis lo p3 Exercise 13-9 Risk and capital structure analysis LO P3 The following information applies to the questions
Exercise 13-9 Risk and capital structure analysis lo p3
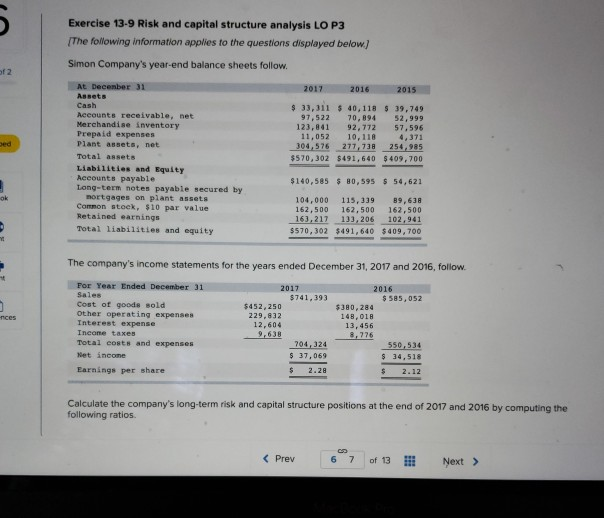
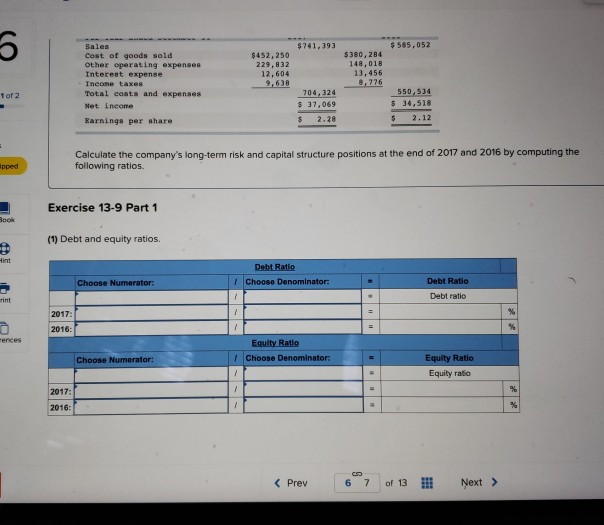
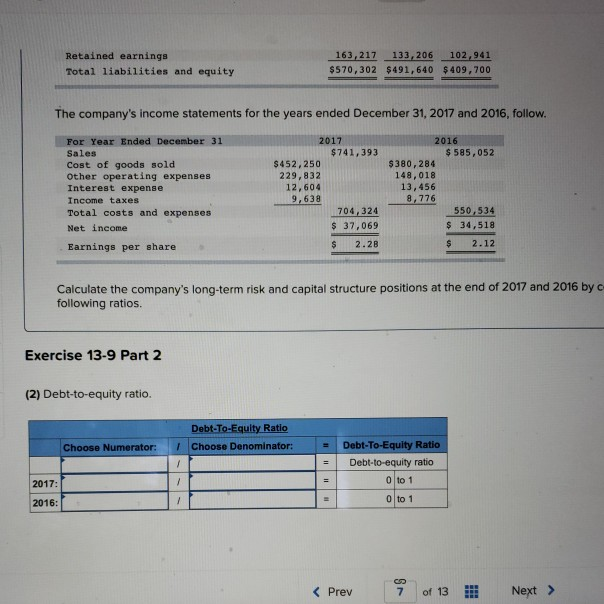
Exercise 13-9 Risk and capital structure analysis LO P3 The following information applies to the questions displayed below) Simon Company's year-end balance sheets follow. 2017 2016 2015 At December 31 Assets Cash Accounts receivable, net Merchandise inventory Prepaid expenses Plant assets, net Total assets Liabilities and Equity Accounts payable Long-ter notes payable secured by mortgages on plant assets Common stock, $10 par value Retained earnings Total liabilities and equity $ 33,311 $ 40,118 $ 39,749 97,522 70,894 52,999 123.841 92,772 57,596 11.052 10, 118 4,371 304,576 277,738 254.985 $570,302 $491,640 $409,700 $140,585 $ 80,595 54,621 104,000 115.39 89,638 162,500 162,500 162,500 163,217 133,206 102,941 $570,302 $491,640 $409,700 The company's income statements for the years ended December 31, 2017 and 2016, follow. For Year Ended December 31 Sales Cost of goods sold Other operating expenses Interest expense Income taxes Total costs and expenses Net Income 2017 2016 $741,393 $ 585,052 $452,250 S80,284 229,832 148,018 12,604 13,456 9,638 8.776 704.324 550.534 $ 37,069 $ 2.28 Earnings per share Calculate the company's long-term risk and capital structure positions at the end of 2017 and 2016 by computing the following ratios. $741,393 $ 585,052 $452,250 229,832 12,604 Cost of goods sald Other operating expenses Intereat expense Income taxes Total costs and expenses Net i nem $380,284 148,018 13,456 8,776 1 of 2 704.324 $ 37,069 550,534 $ 34,518 Earnings per share $ 2.28 $ 2.12 Calculate the company's long-term risk and capital structure positions at the end of 2017 and 2016 by computing the following ratios. Exercise 13-9 Part 1 (1) Debt and equity ratios. Debt Ratio 1 Choose Denominator: Choose Numerator: - Debt Ratio Debt ratio Do 2016 Equity Ratio Choose Denominator Choose Numerator: Equity Ratio Equity ratio 2017: 2016: Retained earnings Total liabilities and equity 163,217 133,206 102,941 $570,302 $491,640 $409,700 The company's income statements for the years ended December 31, 2017 and 2016, follow. For Year Ended December 31 Sales Cost of goods sold Other operating expenses Interest expense Income taxes Total costs and expenses Net income Earnings per share 2017 $741,393 $452,250 229,832 12,604 9.638 704.324 $ 37,069 2016 $ 585,052 $380,284 148,018 13,456 8,776 550.534 $ 34,518 $ 2.12 Calculate the company's long-term risk and capital structure positions at the end of 2017 and 2016 byc following ratios. Exercise 13-9 Part 2 (2) Debt-to-equity ratio. Debt-To-Equity Ratio Choose Denominator Choose Numerator: Debt-to-Equity Ratio Debt-to-equity ratio 0 to 1 0 to 1 2017: 2016:
Step by Step Solution
There are 3 Steps involved in it
Step: 1

Get Instant Access to Expert-Tailored Solutions
See step-by-step solutions with expert insights and AI powered tools for academic success
Step: 2

Step: 3
Ace Your Homework with AI
Get the answers you need in no time with our AI-driven, step-by-step assistance
Get Started
The Fraud Audit Responding To The Risk Of Fraud In Core Business Systems
Authors: Leonard W. Vona
1st Edition
0470647264, 978-0470647264