

Answered step by step
Verified Expert Solution
Question
1 Approved Answer
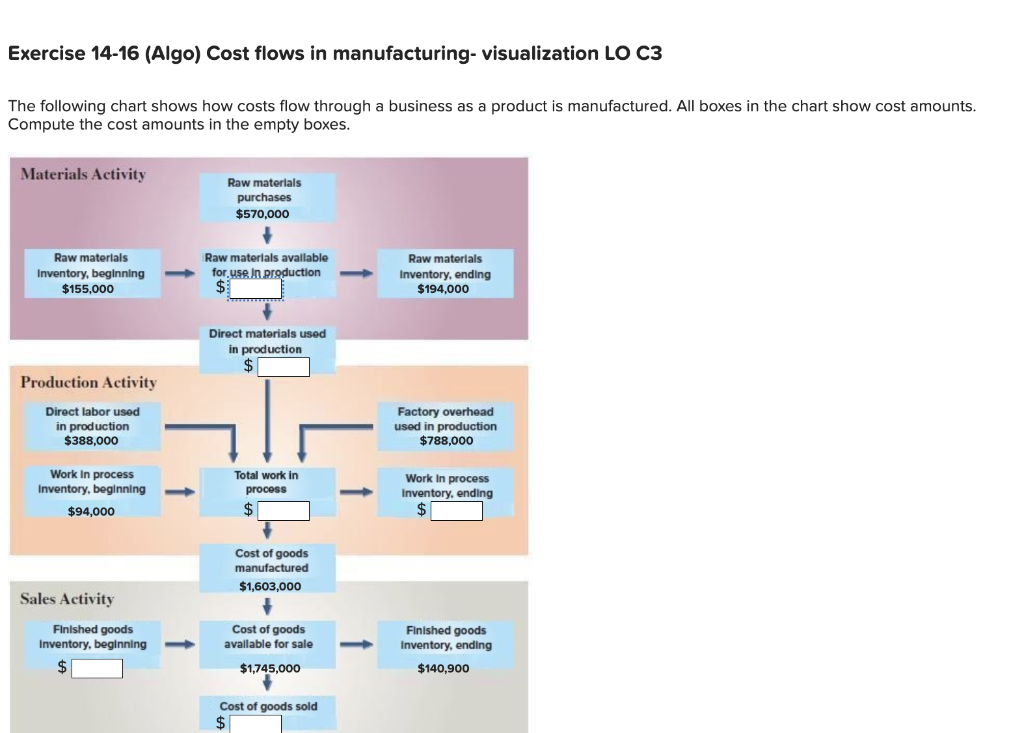
Exercise 14-16 (Algo) Cost flows in manufacturing- visualization LO C3 The following chart shows how costs flow through a business as a product is manufactured.
Step by Step Solution
There are 3 Steps involved in it
Step: 1

Get Instant Access to Expert-Tailored Solutions
See step-by-step solutions with expert insights and AI powered tools for academic success
Step: 2

Step: 3
Ace Your Homework with AI
Get the answers you need in no time with our AI-driven, step-by-step assistance
Get Started
Investment Grade Energy Audit Making Smart Energy Choices
Authors: Shirley J. Hansen, James W. Brown
1st Edition
0824709284, 978-0824709280