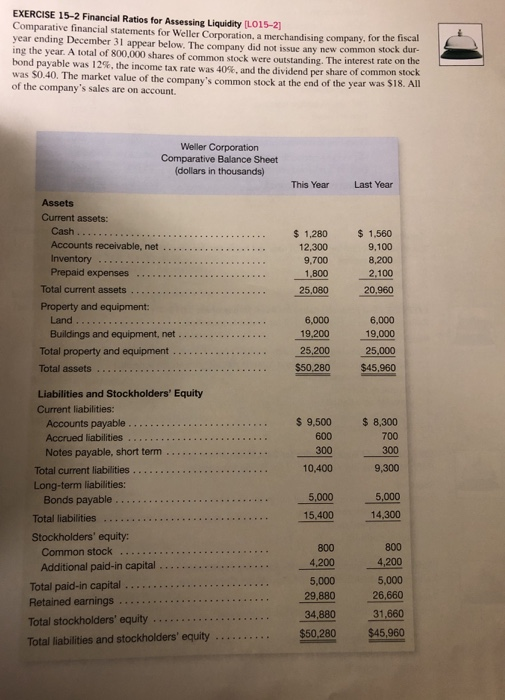
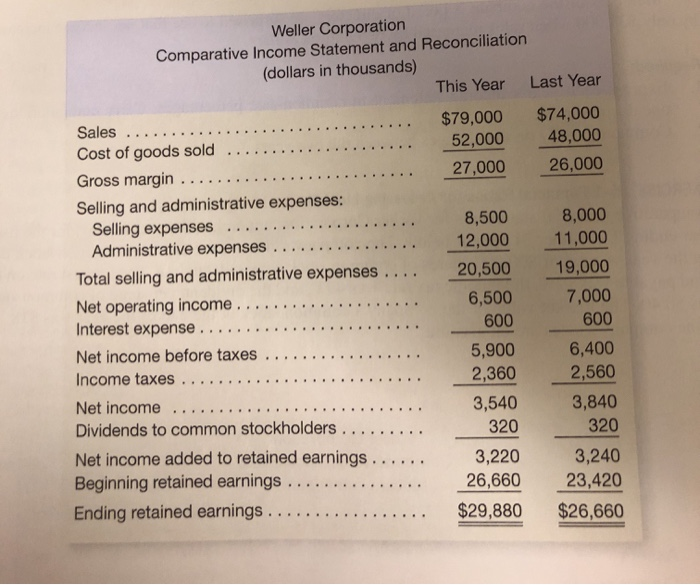
EXERCISE 15-2 Financial Ratios for Assessing Liquidity (L015-21 Comparative financial statements for Weller Corporation, a merchandising company, for the fiscal year ending December 31 appear below. The company did not issue any new common stock dur- ing the year. A total of 800,000 shares of common stock were outstanding. The interest rate on the bond payable was 12%, the income tax rate was 40%, and the dividend per share of common stock was $0.40. The market value of the company's common stock at the end of the year was $18. All of the company's sales are on account. Weller Corporation Comparative Balance Sheet (dollars in thousands) This Year Last Year $ 1.560 9,100 Assets Current assets: Cash.. Accounts receivable, net Inventory Prepaid expenses .......... Total current assets ............ Property and equipment: Land .. Buildings and equipment, net .. Total property and equipment ............ Total assets .. $ 1,280 12,300 9,700 1.800 25,080 8,200 2,100 20,960 6,000 19.200 25,200 $50.280 6,000 19,000 25,000 $45.960 $ 9,500 600 300 10,400 $ 8,300 700 300 9,300 5.000 Liabilities and Stockholders' Equity Current liabilities: Accounts payable ......... Accrued liabilities Notes payable, short term ........ Total current liabilities ...... Long-term liabilities: Bonds payable .... Total liabilities ......... Stockholders' equity: Common stock ............ Additional paid-in capital ........ Total paid-in capital ............... Retained earnings ............. Total stockholders' equity ............ Total liabilities and stockholders' equity .......... 5,000 14,300 15,400 800 4,200 5,000 29,880 34,880 $50,280 800 4,200 5,000 26,660 31,660 $45,960 Weller Corporation Comparative Income Statement and Reconciliation (dollars in thousands) This Year Last Year $79,000 52,000 27,000 $74,000 48,000 26,000 Sales ....... Cost of goods sold .... Gross margin ............ Selling and administrative expenses: Selling expenses ...... Administrative expenses .......... Total selling and administrative expenses .... Net operating income .... Interest expense ..... Net income before taxes. Income taxes .......... Net income ......... Dividends to common stockholders ..... Net income added to retained earnings ...... Beginning retained earnings ........ Ending retained earnings ....... 8,500 12,000 20,500 6,500 600 5,900 2,360 3,540 320 3,220 26,660 $29,880 8,000 11,000 19,000 7,000 600 6,400 2,560 3,840 320 3,240 23,420 $26,660 EXERCISE 15-5 Financial Ratios for Assessing Profitability (L015-5) Refer to the data in Exercise 15-2 for Weller Corporation. Required: Compute the following financial data for this year: 1. Gross margin percentage. 2. Net profit margin percentage. 3. Return on total assets. 4. Return on equity