

Answered step by step
Verified Expert Solution
Question
1 Approved Answer
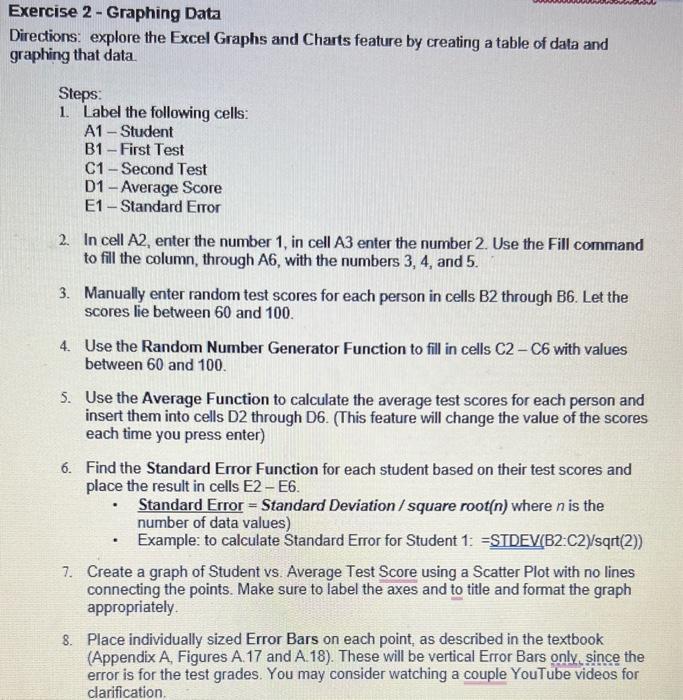
Exercise 2 - Graphing Data Directions: explore the Excel Graphs and Charts feature by creating a table of dala and graphing that data. Steps: 1.
Step by Step Solution
There are 3 Steps involved in it
Step: 1

Get Instant Access to Expert-Tailored Solutions
See step-by-step solutions with expert insights and AI powered tools for academic success
Step: 2

Step: 3
Ace Your Homework with AI
Get the answers you need in no time with our AI-driven, step-by-step assistance
Get Started
Spatial Databases A Tour
Authors: Shashi Shekhar, Sanjay Chawla
1st Edition
0130174807, 978-0130174802