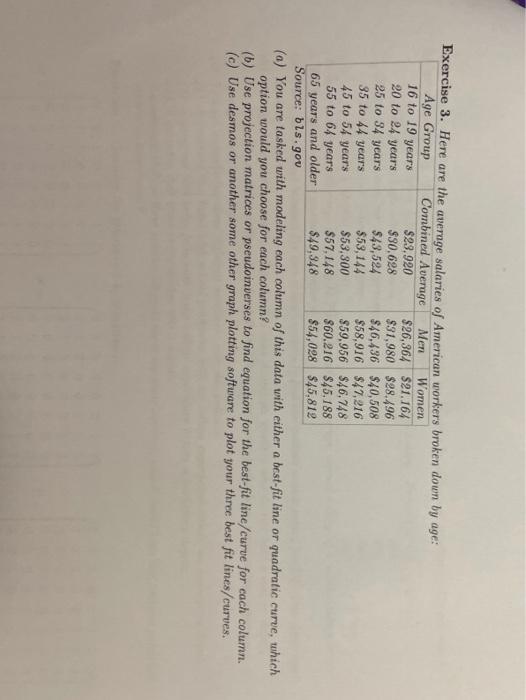
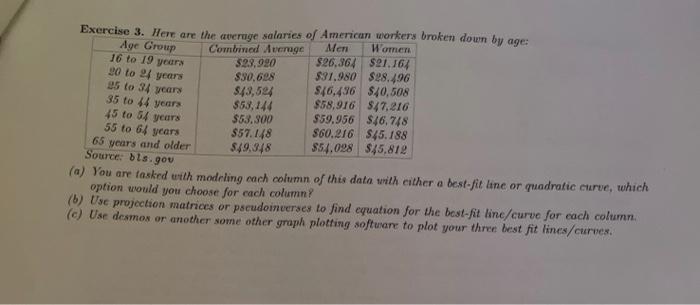
Exercise 3. Here are the average salaries of American workers broken down by age: Age Group Combined Average Men Women 16 to 19 years $23.920 $26,364 $21.164 20 to 24 years $30.698 $31,980 $28.196 25 to 34 years $43,524 $46,436 $40,508 35 to 44 years $53,144 $58,916 $47,216 45 to 54 years $53,300 $59.956 $46.748 55 to 64 years $57,148 860.216 $45.188 65 years and older $49,348 $54,098 $45,812 Source: bls.gov (a) You are tasked with modeling each column of this data with either a best-fit line or quadratic curve, which option would you choose for each column? (b) Use projection matrices or pseudoinverses to find equation for the best-fit line/curue for cach column. (c) Use desmos or another some other graph plotting software to plot your three best fit lines/curves. Exercise 3. Here are the average salaries of American workers broken down by age: Age Group Combined Average Meni Women $2.3, 920 $26,364 $21.164 $30,698 $31.980 $28.496 $43,594 $46.436 $40,508 $53,144 $58,916 $47.216 $53.900 $59.956 $46,748 $57.148 860.216 $45.188 65 years and older 549,348 $54,098 $45.812 16 to 19 years 90 to 24 years 25 to 34 years 35 to 64 years 45 to 54 years 55 to 64 years Source: bls.gov (a) You are tasked with modeling each column of this data with either a best-fit line or quadratic curve, which option would you choose for each column? (6) Use projection matrices or pseudoinverses to find equation for the best-fit line/curve for each column. (c) Use desmos or another some other graph plotting software to plot your three best fit lines/curves. Exercise 3. Here are the average salaries of American workers broken down by age: Age Group Combined Average Men Women 16 to 19 years $23.920 $26,364 $21.164 20 to 24 years $30.698 $31,980 $28.196 25 to 34 years $43,524 $46,436 $40,508 35 to 44 years $53,144 $58,916 $47,216 45 to 54 years $53,300 $59.956 $46.748 55 to 64 years $57,148 860.216 $45.188 65 years and older $49,348 $54,098 $45,812 Source: bls.gov (a) You are tasked with modeling each column of this data with either a best-fit line or quadratic curve, which option would you choose for each column? (b) Use projection matrices or pseudoinverses to find equation for the best-fit line/curue for cach column. (c) Use desmos or another some other graph plotting software to plot your three best fit lines/curves. Exercise 3. Here are the average salaries of American workers broken down by age: Age Group Combined Average Meni Women $2.3, 920 $26,364 $21.164 $30,698 $31.980 $28.496 $43,594 $46.436 $40,508 $53,144 $58,916 $47.216 $53.900 $59.956 $46,748 $57.148 860.216 $45.188 65 years and older 549,348 $54,098 $45.812 16 to 19 years 90 to 24 years 25 to 34 years 35 to 64 years 45 to 54 years 55 to 64 years Source: bls.gov (a) You are tasked with modeling each column of this data with either a best-fit line or quadratic curve, which option would you choose for each column? (6) Use projection matrices or pseudoinverses to find equation for the best-fit line/curve for each column. (c) Use desmos or another some other graph plotting software to plot your three best fit lines/curves