

Answered step by step
Verified Expert Solution
Question
1 Approved Answer
EXERCISE 3 MNP (UNH/NO) 0,497895212. Exp. Fet of MVP EXERCISE 4 157 155 16. 16 Exerclse 5 For a moment, assume the correlation between the
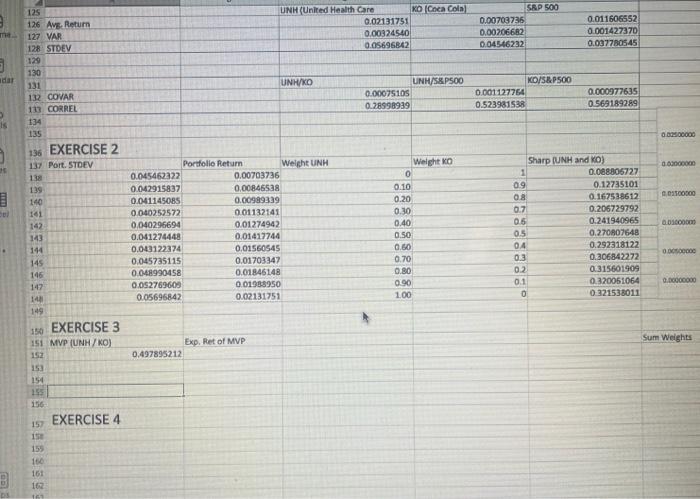
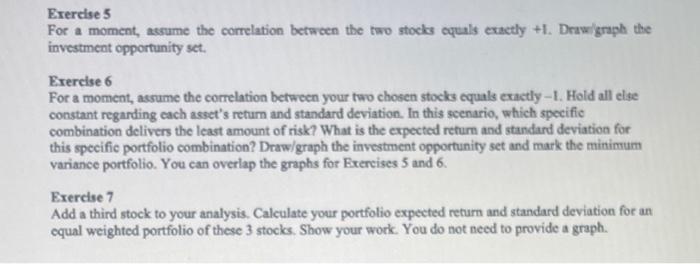 EXERCISE 3 MNP (UNH/NO) 0,497895212. Exp. Fet of MVP EXERCISE 4 157 155 16. 16 Exerclse 5 For a moment, assume the correlation between the two stocks equals exactly +1. Draw/graph the investment opportunity set. Exercise 6 For a moment, assume the correlation between your two chosen stocks equals exactly 1. Hold all else constant regarding each asset's retum and standard deviation. In this scenario, which specific combination delivers the least amount of risk? What is the expected retum and standard deviation for this specific portfolio combination? Draw/graph the investment opportunity set and mark the minimum variance portfolio. You can overiap the graphs for Exercises 5 and 6 . Exercise 7 Add a third stock to your analysis. Calculate your portfolio expected return and standard deviation for an equal weighted portfolio of these 3 stocks. Show your work. You do not need to provide a graph. EXERCISE 3 MNP (UNH/NO) 0,497895212. Exp. Fet of MVP EXERCISE 4 157 155 16. 16 Exerclse 5 For a moment, assume the correlation between the two stocks equals exactly +1. Draw/graph the investment opportunity set. Exercise 6 For a moment, assume the correlation between your two chosen stocks equals exactly 1. Hold all else constant regarding each asset's retum and standard deviation. In this scenario, which specific combination delivers the least amount of risk? What is the expected retum and standard deviation for this specific portfolio combination? Draw/graph the investment opportunity set and mark the minimum variance portfolio. You can overiap the graphs for Exercises 5 and 6 . Exercise 7 Add a third stock to your analysis. Calculate your portfolio expected return and standard deviation for an equal weighted portfolio of these 3 stocks. Show your work. You do not need to provide a graph
Step by Step Solution
There are 3 Steps involved in it
Step: 1

Get Instant Access to Expert-Tailored Solutions
See step-by-step solutions with expert insights and AI powered tools for academic success
Step: 2

Step: 3
Ace Your Homework with AI
Get the answers you need in no time with our AI-driven, step-by-step assistance
Get Started
Valuation Workbook
Authors: Tim Koller, Marc Goedhart, David Wessels, Jeffrey P. Lessard, McKinsey & Company
4th Edition
0471702161, 978-0471702160