

Answered step by step
Verified Expert Solution
Question
1 Approved Answer
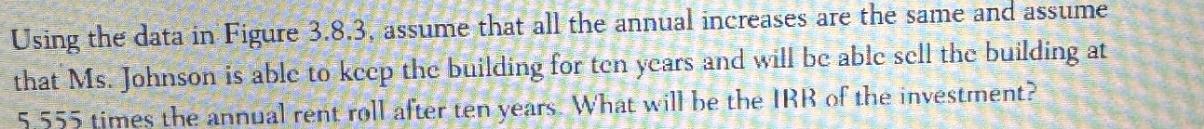
Using the data in Figure 3.8.3, assume that all the annual increases are the same and assume that Ms. Johnson is able to keep
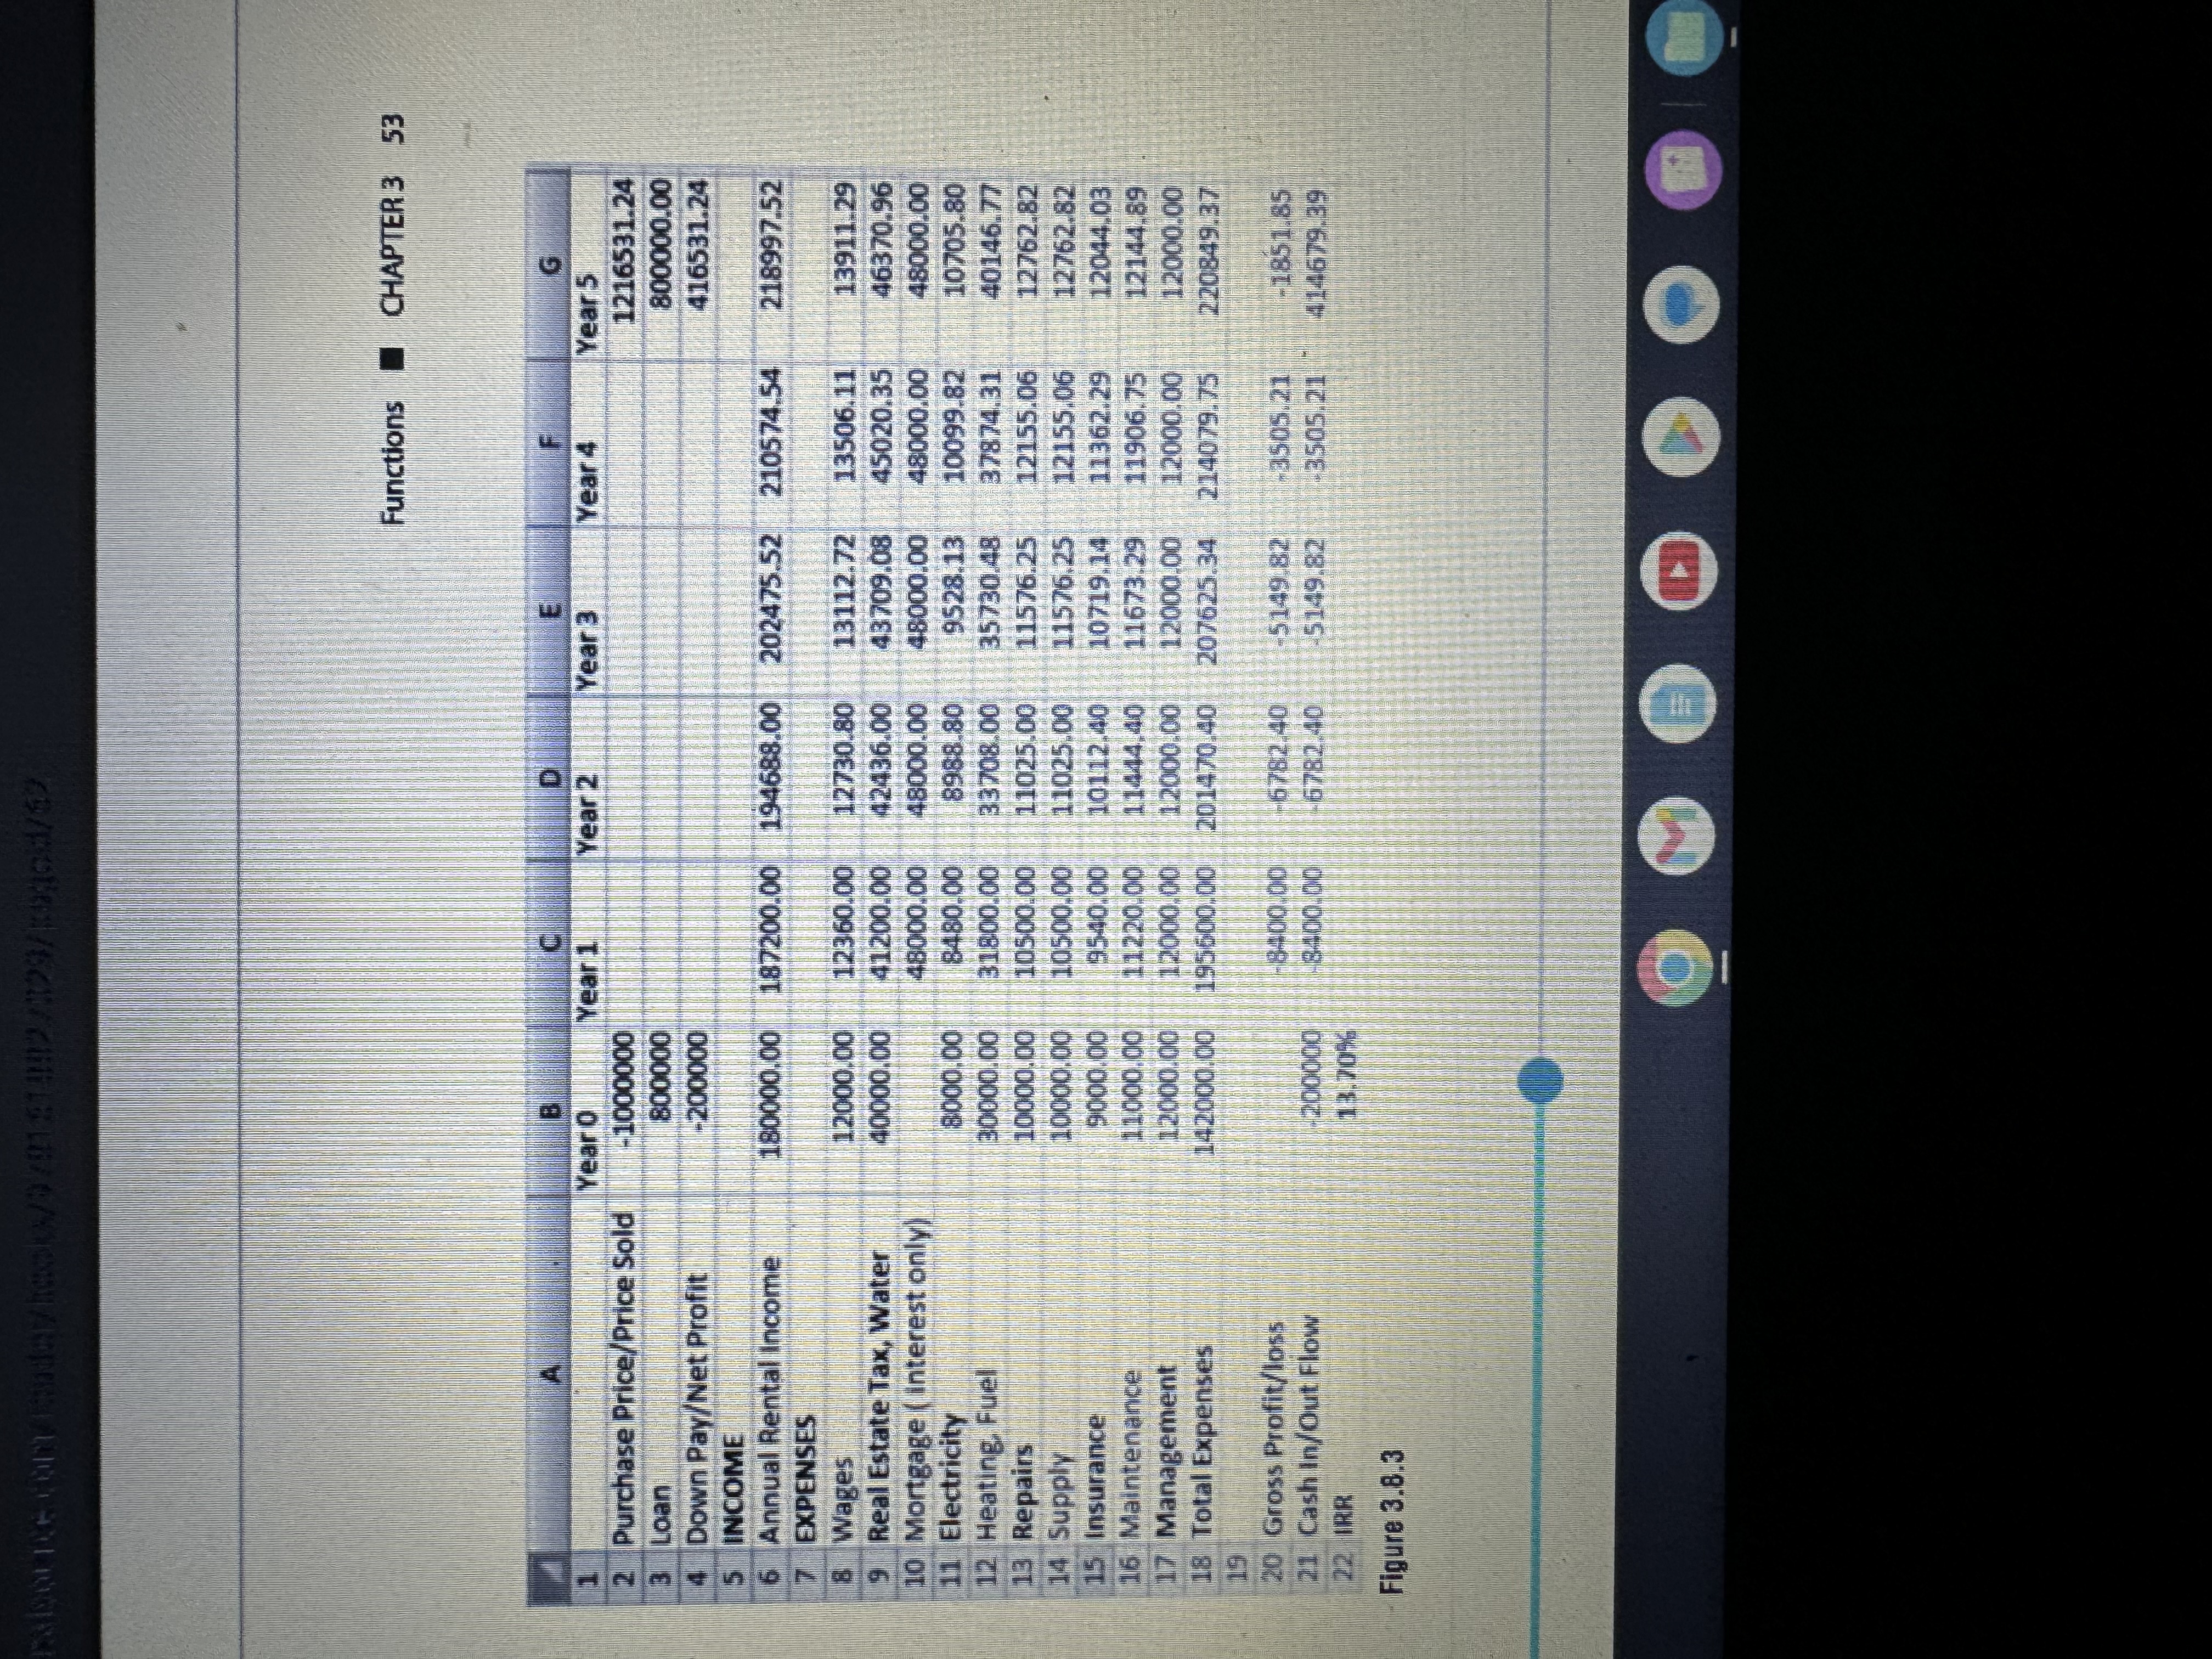
Using the data in Figure 3.8.3, assume that all the annual increases are the same and assume that Ms. Johnson is able to keep the building for ten years and will be able sell the building at 5.555 times the annual rent roll after ten years. What will be the IRR of the investment? PADORE CORY Badezhest/9/8181892/29/go/62 A 1 2 Purchase Price/Price Sold 3 Loan 4 Down Pay/Net Profit 5 INCOME 6 Annual Rental income 7 EXPENSES 8 Wages 9 Real Estate Tax, Water 10 Mortgage (interest only) 11 Electricity 12 Heating, Fuel 13 Repairs 14 Supply 15 Insurance 16 Maintenance 17 Management 18 Total Expenses 20 Gross Profit/loss 21 Cash In/Out Flow 22 IBR Figure 3.8.3 3 Year O -1000000 800000 -200000 alb Year 1 4 Year 2 Year 3 Functions CHAPTER 3 53 8400.00 -6782.40 -200000 -8400.00 6782.40 13.70% F Year 4 TARI 10099.82 12000.00 12360.00 12730.80 13112.72 13506.11 40000.00 41200.00 42436.00 43709.08 45020.35 48000.00 48000.00 48000.00 48000.00 8000.00 8480.00 8988.80 9528.13 30000.00 31800.00 33708.00 35730.48 37874.31 10000.00 10500.00 11025.00 11576.25 12155.06 10000.00 10500.00 11025.00 11576.25 12155.06 9000.00 9540.00 10112.40 10719.14 11362.29 11000.00 11220.00 11444.40 11673.29 11906.75 12000.00 12000.00 12000.00 12000.00 12000.00 142000.00 195600.00 201470.40 207625.34 214079.75 Year 5 5 180000.00 187200.00 194688.00 202475.52 210574.54 218997.52 1216531.24 800000.00 416531.24 13911.29 46370.96 48000.00 10705.80 40146.77 12762.82 12762.82 12044.03 12144.89 12000.00 220849.37 5149 82 -3505.21 -1851.85 5149.82 +3505.21 414679.39 17 4110 Using the data in Figure 3.8.3, assume that all the annual increases are the same and assume that Ms. Johnson is able to keep the building for ten years and will be able sell the building at 5.555 times the annual rent roll after ten years. What will be the IRR of the investment? PADORE CORY Badezhes/9/9121892/29/pagod/62 A 1 2 Purchase Price/Price Sold 3 Loan 4 Down Pay/Net Profit 5 INCOME 6 Annual Rental income 7 EXPENSES 8 Wages 9 Real Estate Tax, Water 10 Mortgage (interest only) 11 Electricity 12 Heating, Fuel 13 Repairs 14 Supply 15 Insurance 16 Maintenance 17 Management 18 Total Expenses 20 Gross Profit/loss 21 Cash In/Out Flow 22 IBR Figure 3.8.3 3 Year O -1000000 800000 -200000 alb Year 1 4 Year 2 Year 3 Functions CHAPTER 3 53 8400.00 -6782.40 -200000 -8400.00 6782.40 13.70% F Year 4 TARI 10099.82 12000.00 12360.00 12730.80 13112.72 13506.11 40000.00 41200.00 42436.00 43709.08 45020.35 48000.00 48000.00 48000.00 48000.00 8000.00 8480.00 8988.80 9528.13 30000.00 31800.00 33708.00 35730.48 37874.31 10000.00 10500.00 11025.00 11576.25 12155.06 10000.00 10500.00 11025.00 11576.25 12155.06 9000.00 9540.00 10112.40 10719.14 11362.29 11000.00 11220.00 11444.40 11673.29 11906.75 12000.00 12000.00 12000.00 12000.00 12000.00 142000.00 195600.00 201470.40 207625.34 214079.75 Year 5 5 180000.00 187200.00 194688.00 202475.52 210574.54 218997.52 1216531.24 800000.00 416531.24 13911.29 46370.96 48000.00 10705.80 40146.77 12762.82 12762.82 12044.03 12144.89 12000.00 220849.37 5149 82 -3505.21 -1851.85 5149.82 +3505.21 414679.39 17 4110 Using the data in Figure 3.8.3, assume that all the annual increases are the same and assume that Ms. Johnson is able to keep the building for ten years and will be able sell the building at 5.555 times the annual rent roll after ten years. What will be the IRR of the investment? PADORS CORY Badezhestv/9/8181892/29/pagod/62 A 1 2 Purchase Price/Price Sold 3 Loan 4 Down Pay/Net Profit 5 INCOME 6 Annual Rental income 7 EXPENSES 8 Wages 9 Real Estate Tax, Water 10 Mortgage (interest only) 11 Electricity 12 Heating, Fuel 13 Repairs 14 Supply 15 Insurance 16 Maintenance 17 Management 18 Total Expenses 20 Gross Profit/loss 21 Cash In/Out Flow 22 IBR Figure 3.8.3 3 Year O -1000000 800000 -200000 alb Year 1 4 Year 2 Year 3 Functions CHAPTER 3 53 8400.00 -6782.40 -200000 -8400.00 6782.40 13.70% F Year 4 TARI 10099.82 12000.00 12360.00 12730.80 13112.72 13506.11 40000.00 41200.00 42436.00 43709.08 45020.35 48000.00 48000.00 48000.00 48000.00 8000.00 8480.00 8988.80 9528.13 30000.00 31800.00 33708.00 35730.48 37874.31 10000.00 10500.00 11025.00 11576.25 12155.06 10000.00 10500.00 11025.00 11576.25 12155.06 9000.00 9540.00 10112.40 10719.14 11362.29 11000.00 11220.00 11444.40 11673.29 11906.75 12000.00 12000.00 12000.00 12000.00 12000.00 142000.00 195600.00 201470.40 207625.34 214079.75 Year 5 5 180000.00 187200.00 194688.00 202475.52 210574.54 218997.52 1216531.24 800000.00 416531.24 13911.29 46370.96 48000.00 10705.80 40146.77 12762.82 12762.82 12044.03 12144.89 12000.00 220849.37 5149 82 -3505.21 -1851.85 5149.82 +3505.21 414679.39 17 4110
Step by Step Solution
There are 3 Steps involved in it
Step: 1
The IRR of the investment for 10 years tenure can be calculated as shown in the following table Year 0 Year 1 Year 2 Year 3 Year 4 Year 5 Year 6 Year 7 Year 8 Year 9 Year 10 Purchase PricePrice Sold 1...
Get Instant Access to Expert-Tailored Solutions
See step-by-step solutions with expert insights and AI powered tools for academic success
Step: 2

Step: 3
Ace Your Homework with AI
Get the answers you need in no time with our AI-driven, step-by-step assistance
Get Started
Statistics Unlocking The Power Of Data
Authors: Robin H. Lock, Patti Frazer Lock, Kari Lock Morgan, Eric F. Lock, Dennis F. Lock
1st Edition
0470601876, 978-0470601877