Exercise 4.3 The county assessor is studying housing demand and is interested in developing a regression model to estimate the market value (i.e., selling price)
Exercise 4.3
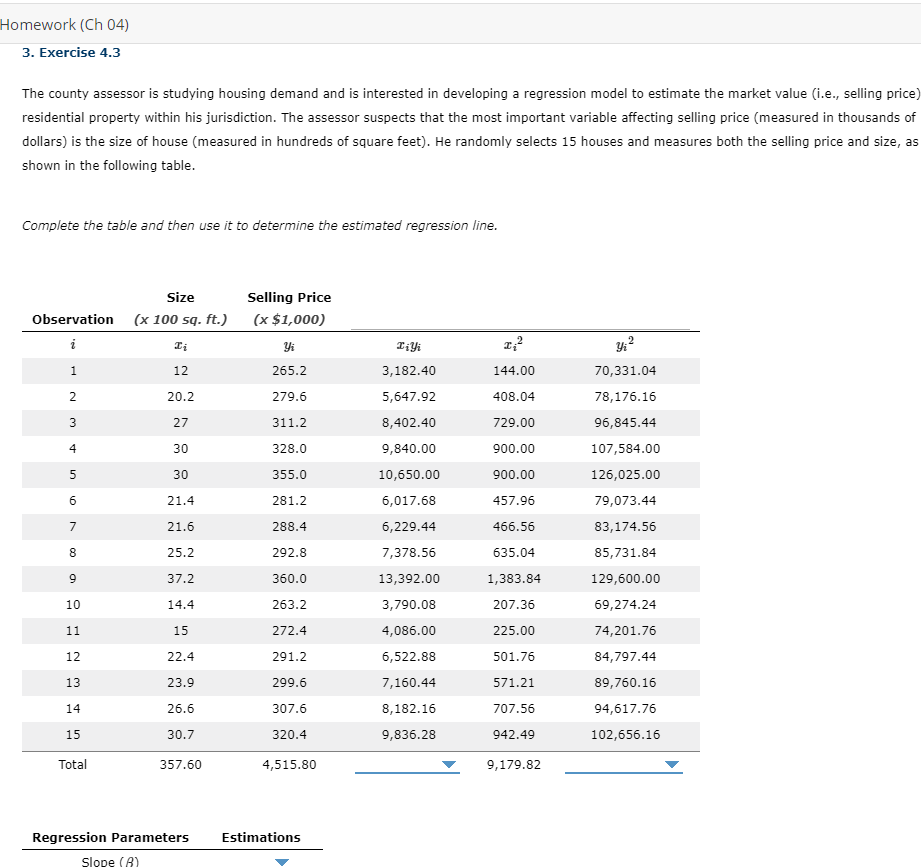
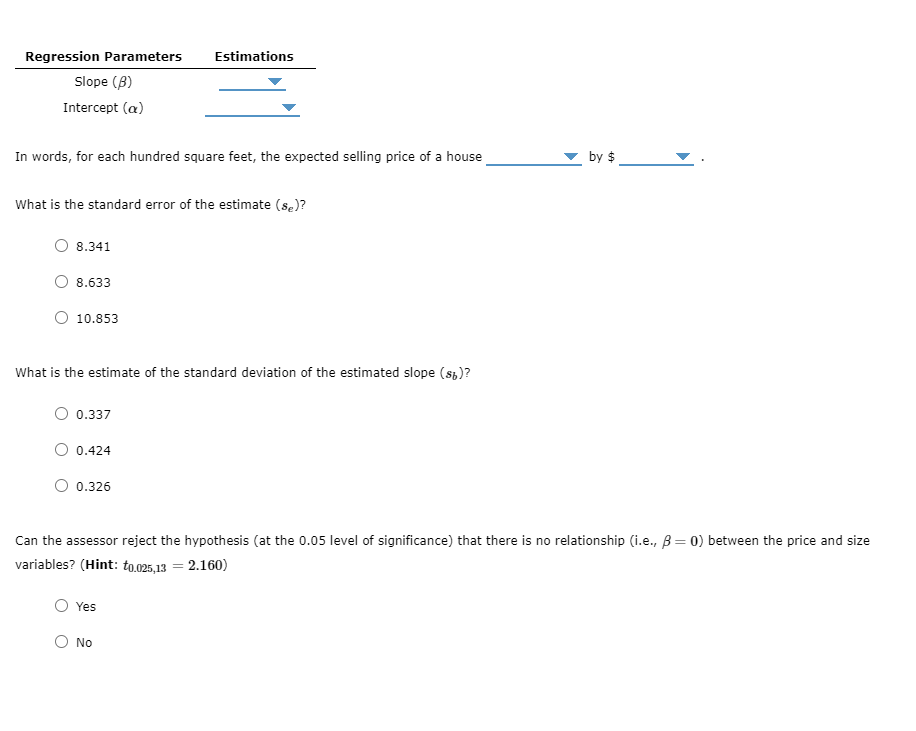
The county assessor is studying housing demand and is interested in developing a regression model to estimate the market value (i.e., selling price) of residential property within his jurisdiction. The assessor suspects that the most important variable affecting selling price (measured in thousands of dollars) is the size of house (measured in hundreds of square feet). He randomly selects 15 houses and measures both the selling price and size, as shown in the following table.
Complete the table and then use it to determine the estimated regression line.
Observation
Size
Selling Price
(x 100 sq. ft.)
(x $1,000)
i?
xi??
yi??
xi??yi??
xi2??2
yi2??2
1
12
265.2
3,182.40
144.00
70,331.04
2
20.2
279.6
5,647.92
408.04
78,176.16
3
27
311.2
8,402.40
729.00
96,845.44
4
30
328.0
9,840.00
900.00
107,584.00
5
30
355.0
10,650.00
900.00
126,025.00
6
21.4
281.2
6,017.68
457.96
79,073.44
7
21.6
288.4
6,229.44
466.56
83,174.56
8
25.2
292.8
7,378.56
635.04
85,731.84
9
37.2
360.0
13,392.00
1,383.84
129,600.00
10
14.4
263.2
3,790.08
207.36
69,274.24
11
15
272.4
4,086.00
225.00
74,201.76
12
22.4
291.2
6,522.88
501.76
84,797.44
13
23.9
299.6
7,160.44
571.21
89,760.16
14
26.6
307.6
8,182.16
707.56
94,617.76
15
30.7
320.4
9,836.28
942.49
102,656.16
Total
357.60
4,515.80
9,179.82
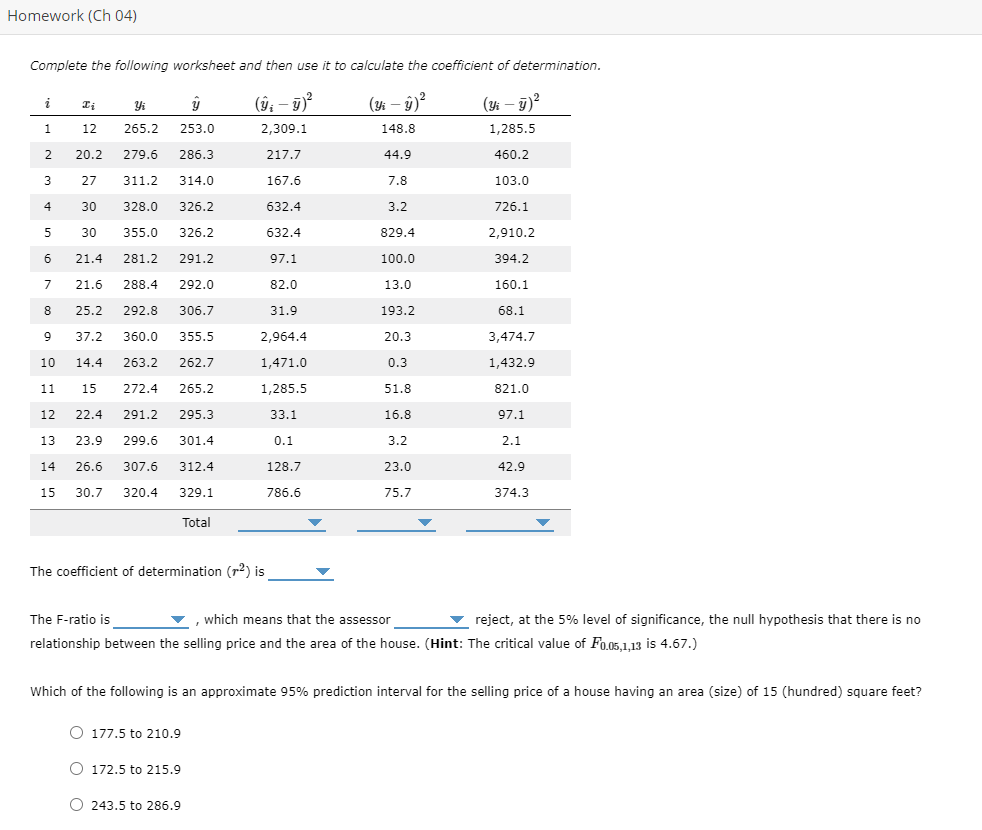
Homework (Ch 04) 3. Exercise 4.3 The county assessor is studying housing demand and is interested in developing a regression model to estimate the market value (i.e., selling price) residential property within his jurisdiction. The assessor suspects that the most important variable affecting selling price (measured in thousands of dollars) is the size of house (measured in hundreds of square feet). He randomly selects 15 houses and measures both the selling price and size, as shown in the following table. Complete the table and then use it to determine the estimated regression line. Size Observation i T; 1 12 2 20.2 3 27 4 30 5 30 B 21.4 7 21.6 8 25.2 9 37.2 10 14.4 11 15 12 22.4 13 23.9 14 26.6 15 30.7 Total 357.60 Regression Parameters (x 100 sq. ft.) Selling Price (x $1,000) Yi 265.2 279.6 311.2 328.0 355.0 281.2 288.4 202.8 360.0 263.2 272.4 291.2 299.6 307.6 320.4 4,515.80 Estimations Slope (A w Till 3,182.40 5,647.92 8,402.40 9,840.00 10,650.00 6,017.68 6,229.44 7,378.56 13,392.00 3,790.08 4,086.00 6,522.88 7,160.44 8,182.16 9,836.28 w .'Big 144.00 408.04 729.00 900.00 900.00 457.96 466.56 635.04 1,383.84 207.36 225.00 501.76 571.21 707.56 942.49 9,179.82 y'_ 70,331.04 78,176.16 96,845.44 107,584.00 126,025.00 79,073.44 83,174.56 85,731.84 129,600.00 69,274.24 74,201.76 84,797.44 89,760.16 94,617.76 102,656.16 Regression Parameters Estimations Slope () - Intercept (o) b In words, for each hundred square feet, the expected selling price of a house w by v . What is the standard error of the estimate (s.)? ) 8.341 ) 8.633 ) 10.853 What is the estimate of the standard deviation of the estimated slope (s3)? ) 0.237 ) 0.424 ) 0.326 Can the assessor reject the hypothesis (at the 0.05 level of significance) that there is no relationship (i.e., 8 = 0) between the price and size variables? (Hint: #p 2513 = 2.160) O Yes O No Regression Parameters Estimations Slope () - Intercept (o) b In words, for each hundred square feet, the expected selling price of a house w by v . What is the standard error of the estimate (s.)? ) 8.341 ) 8.633 ) 10.853 What is the estimate of the standard deviation of the estimated slope (s3)? ) 0.237 ) 0.424 ) 0.326 Can the assessor reject the hypothesis (at the 0.05 level of significance) that there is no relationship (i.e., 8 = 0) between the price and size variables? (Hint: #p 2513 = 2.160) O Yes O No Homewark (Ch 04) Complete the following worksheet and then use it to calculate the coefficient of determination. i n ow (9: 9) ( 9) (w9) i 12 265.2 253.0 2,309.1 148.8 1,285.5 2 20.2 279.6 286.3 217.7 44,9 460.2 3 27 311.2 314.0 167.6 7.8 103.0 4 30 328.0 326.2 632.4 3.2 726.1 5 30 355.0 326.2 632.4 829.4 2,910.2 6 21.4 281.2 291.2 a7.1 100.0 3084.2 7 21.6 288.4 292.0 82.0 13.0 160.1 8 25.2 292.8 306.7 31.9 193.2 68.1 9 37.2 360.0 355.5 2,964.4 20.3 3,474.7 10 14.4 263.2 262.7 1,471.0 0.3 1,432.9 11 15 272.4 265.2 1,285.5 51.8 821.0 12 22.4 291.2 295.3 33.1 16.8 97.1 13 23.9 299.6 301.4 0.1 3.2 2.1 14 26.6 307.6 312.4 128.7 23.0 42.9 15 30.7y 320.4 329.1 786.6 75.7 374.3 Total - > The coefficient of determination {1'2} is - The F-ratio is w , which means that the assessor W reject, at the 5% level of significance, the null hypothesis that there is no relationship between the selling price and the area of the house. (Hint: The critical value of Fyps 13 is 4.67.) wWhich of the following is an approximate 95% prediction interval for the selling price of a house having an area (size) of 15 (hundred) square feet? ) 177.5to 210.9 () 172.5t0 215.9 ) 243.5 to 286.9 Homewark (Ch 04) Complete the following worksheet and then use it to calculate the coefficient of determination. i n ow (9: 9) ( 9) (w9) i 12 265.2 253.0 2,309.1 148.8 1,285.5 2 20.2 279.6 286.3 217.7 44,9 460.2 3 27 311.2 314.0 167.6 7.8 103.0 4 30 328.0 326.2 632.4 3.2 726.1 5 30 355.0 326.2 632.4 829.4 2,910.2 6 21.4 281.2 291.2 a7.1 100.0 3084.2 7 21.6 288.4 292.0 82.0 13.0 160.1 8 25.2 292.8 306.7 31.9 193.2 68.1 9 37.2 360.0 355.5 2,964.4 20.3 3,474.7 10 14.4 263.2 262.7 1,471.0 0.3 1,432.9 11 15 272.4 265.2 1,285.5 51.8 821.0 12 22.4 291.2 295.3 33.1 16.8 97.1 13 23.9 299.6 301.4 0.1 3.2 2.1 14 26.6 307.6 312.4 128.7 23.0 42.9 15 30.7y 320.4 329.1 786.6 75.7 374.3 Total - > The coefficient of determination {1'2} is - The F-ratio is w , which means that the assessor W reject, at the 5% level of significance, the null hypothesis that there is no relationship between the selling price and the area of the house. (Hint: The critical value of Fyps 13 is 4.67.) wWhich of the following is an approximate 95% prediction interval for the selling price of a house having an area (size) of 15 (hundred) square feet? ) 177.5to 210.9 () 172.5t0 215.9 ) 243.5 to 286.9
Step by Step Solution
There are 3 Steps involved in it
Step: 1
Get Instant Access to Expert-Tailored Solutions
See step-by-step solutions with expert insights and AI powered tools for academic success
Step: 2
Step: 3
Ace Your Homework with AI
Get the answers you need in no time with our AI-driven, step-by-step assistance