

Answered step by step
Verified Expert Solution
Question
1 Approved Answer
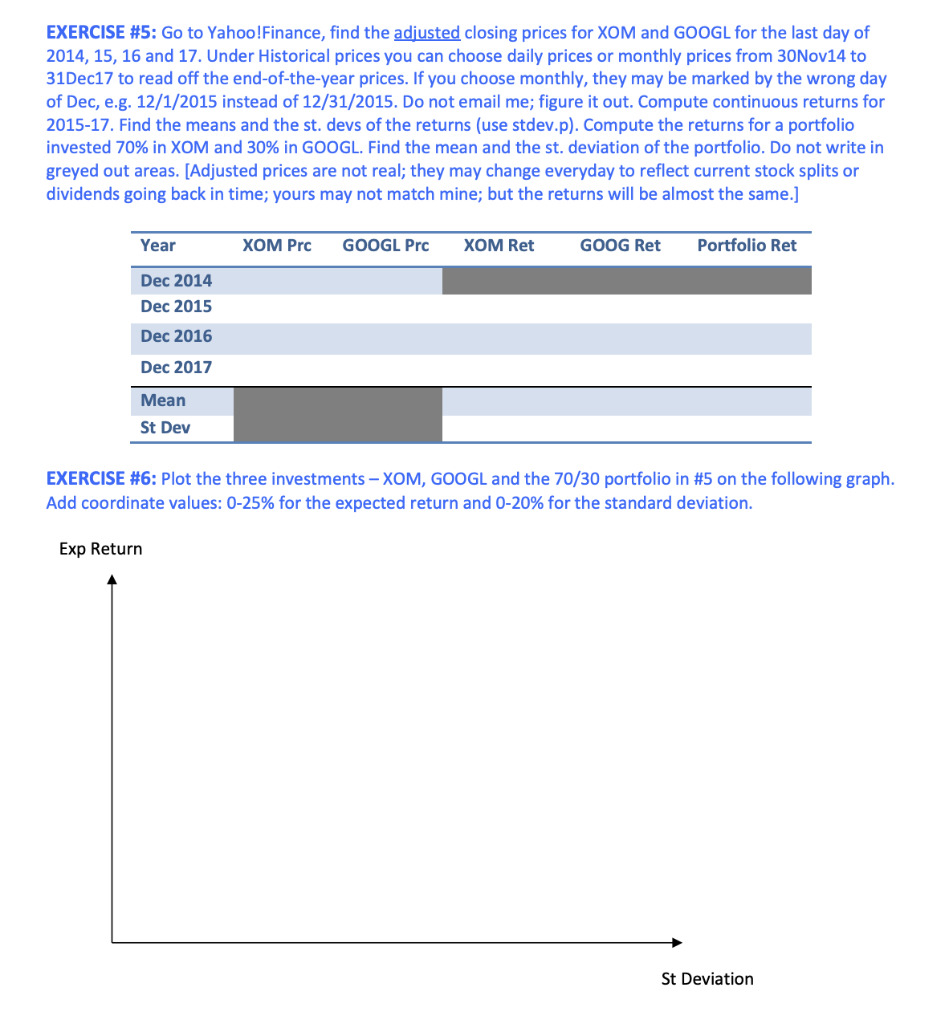
EXERCISE #5: Go to Yahoo!Finance, find the adjusted closing prices for XOM and GOOGL for the last day of 2014, 15, 16 and 17. Under
Step by Step Solution
There are 3 Steps involved in it
Step: 1

Get Instant Access to Expert-Tailored Solutions
See step-by-step solutions with expert insights and AI powered tools for academic success
Step: 2

Step: 3
Ace Your Homework with AI
Get the answers you need in no time with our AI-driven, step-by-step assistance
Get Started
Raising Venture Capital
Authors: Rupert Pearce, Simon Barnes
1st Edition
0470027576, 978-0470027578