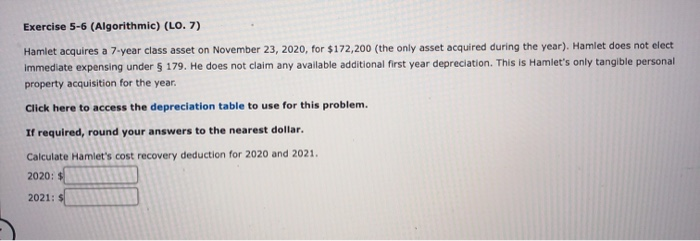
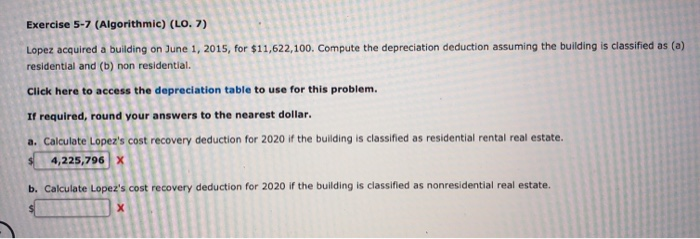
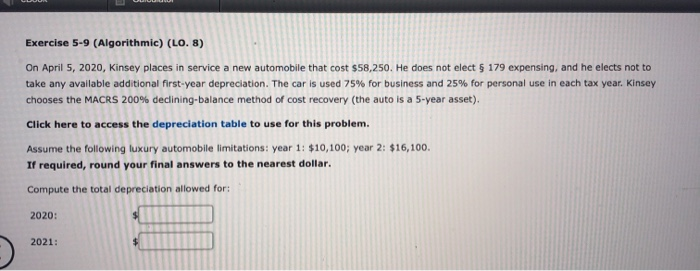
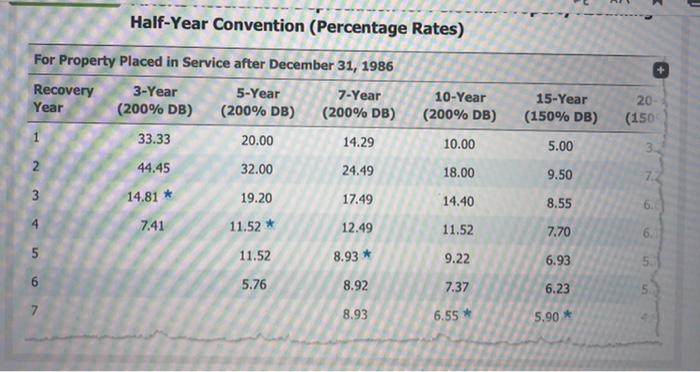
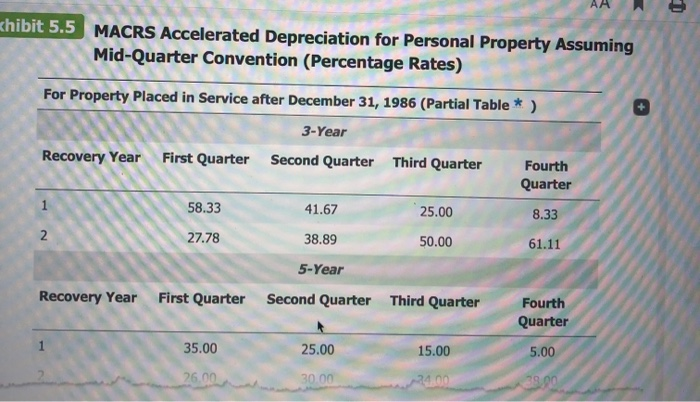
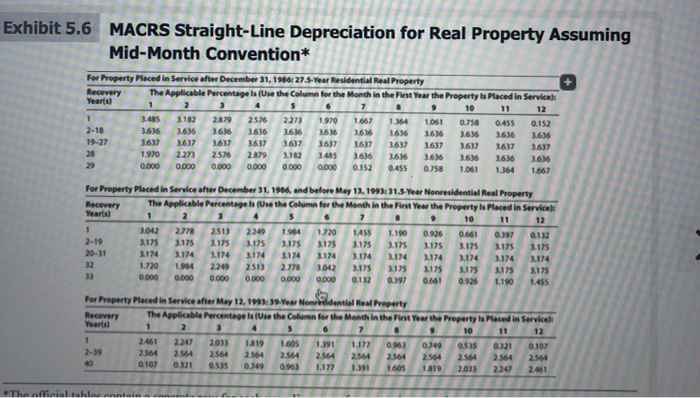
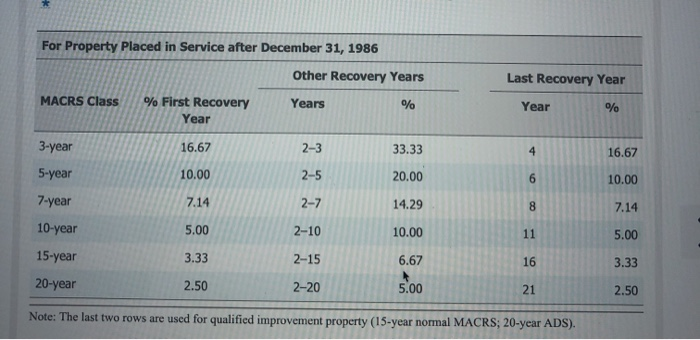
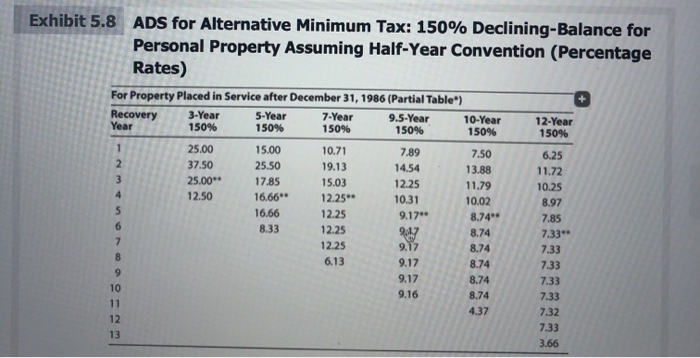
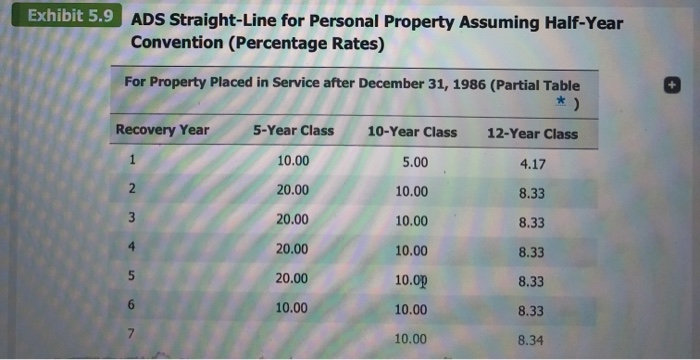
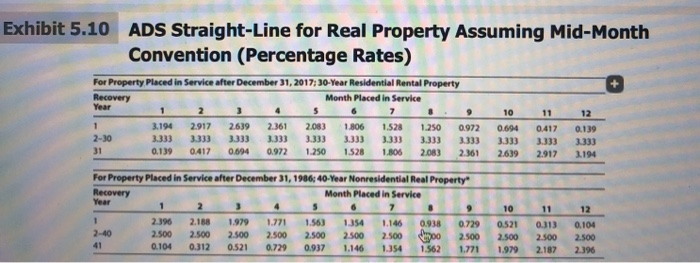
Exercise 5-6 (Algorithmic) (LO. 7) Hamlet acquires a 7-year class asset on November 23, 2020, for $172,200 (the only asset acquired during the year). Hamlet does not elect Immediate expensing under $ 179. He does not claim any available additional first year depreciation. This is Hamlet's only tangible personal property acquisition for the year. Click here to access the depreciation table to use for this problem. If required, round your answers to the nearest dollar. Calculate Hamlet's cost recovery deduction for 2020 and 2021. 2020: $ 2021: $ Exercise 5-7 (Algorithmic) (LO. 7) Lopez acquired a building on June 1, 2015, for $11,622,100. Compute the depreciation deduction assuming the building is classified as (a) residential and (b) non residential. Click here to access the depreciation table to use for this problem. If required, round your answers to the nearest dollar. a. Calculate Lopez's cost recovery deduction for 2020 if the building is classified as residential rental real estate. 4,225,796 x b. Calculate Lopez's cost recovery deduction for 2020 if the building is classified as nonresidential real estate. X Exercise 5-9 (Algorithmic) (LO. 8) On April 5, 2020, Kinsey places in service a new automobile that cost $58,250. He does not elect $ 179 expensing, and he elects not to take any available additional first-year depreciation. The car is used 75% for business and 25% for personal use in each tax year. Kinsey chooses the MACRS 200% declining-balance method of cost recovery (the auto is a 5-year asset). Click here to access the depreciation table to use for this problem. Assume the following luxury automobile limitations: year 1: $10,100; year 2: $16,100. If required, round your final answers to the nearest dollar. Compute the total depreciation allowed for: 2020: 2021: Half-Year Convention (Percentage Rates) + For Property Placed in Service after December 31, 1986 Recovery 3-Year 5-Year 7-Year Year (200% DB) (200% DB) (200% DB) 20 10-Year (200% DB) 10.00 15-Year (150% DB) (150 33.33 20.00 14.29 5.00 2 44.45 32.00 24.49 18.00 9.50 7. 3 14.81 * 19.20 17.49 14.40 8.55 6 7.41 11.52 * 12.49 11.52 7.70 5 8.93 * 9.22 6.93 5 11.52 5.76 6 8.92 7.37 6.23 7 8.93 6.55 * 5.90 * xhibit 5.5 MACRS Accelerated Depreciation for Personal Property Assuming Mid-Quarter Convention (Percentage Rates) For Property Placed in Service after December 31, 1986 (Partial Table * ) 3-Year Recovery Year First Quarter Second Quarter Third Quarter Fourth Quarter 58.33 41.67 25.00 8.33 2. 27.78 38.89 50.00 61.11 5-Year Recovery Year First Quarter Second Quarter Third Quarter Fourth Quarter 35.00 25.00 15.00 5.00 26.00 30.00 -24:00 39.00 Exhibit 5.6 MACRS Straight-Line Depreciation for Real Property Assuming Mid-Month Convention* For Property Placed in Service after December 31, 1986: 27.5-Year Residential Real Property Recovery The Applicable Percentage Is (Use the Column for the Month in the First Year the Property is placed in Serviceli Years 1 2 3 4 5 6 7 & 10 11 12 1 3.485 3.182 2576 2.273 1970 1.667 1.364 1.061 0.758 0.455 0.152 2-18 3.636 3.636 3636 3636 3.636 3.616 3636 3.636 3,636 3.636 3.636 19-27 3.637 3.637 3.637 3.637 3.637 3.637 3.637 3637 3.637 3.617 3637 3.637 28 1.970 2273 2576 2.879 3.182 3.485 3.636 3.636 3.636 3.636 3636 3.636 29 0.000 0.000 0.000 0.000 0.000 0.000 0.152 0.455 1.061 1.364 1,667 3635 0.758 2-19 For Property Placed in Service after December 31, 1984, and before May 13, 1993: 31.5-Year Nonresidential Real Property Recovery The Applicable Percentagels (Use the Column for the Month in the First Year the Property is placed in Service) Year's 1 2 7 . 9 10 11 12 1 3.042 2.778 2513 1984 1.720 1455 1.190 0.926 0.661 0.397 0.132 3.175 3.175 3.175 3.175 3.175 3175 3.175 3.175 3.175 2.175 3.175 3.175 20-31 3.174 3.174 3.174 3.174 3.174 3.174 3.174 3.174 3.174 3.174 3.174 3.174 32 1.720 2513 2.778 3.042 3.175 3.175 3.175 3.175 3.175 3.175 0.000 0.000 0.000 0.000 0.132 0.397 0.661 0.926 1.190 1455 For Property Placed in Service after May 12, 1993: 39-Year Nonresidential Real Property Recovery The Applicable Percentage is (Use the Column for the Month in the First Year the Property is placed in Service Yearts 1 2 3 4 5 6 7 8 10 12 1 2.461 2247 2.033 1.819 1.605 1.391 1.177 0.963 0.749 0.535 0.321 0.107 2.564 2.564 2.564 2.564 2.564 2.564 2.564 2.564 2.564 2.564 2.564 2.564 0.107 0.321 0.535 0.749 0.963 1.177 1.391 1.605 1,819 2033 2.461 *The nffiialtohla nanini For Property Placed in Service after December 31, 1986 Other Recovery Years MACRS Class % First Recovery Years Year Last Recovery Year % Year % 3-year 16.67 2-3 33.33 4 16.67 5-year 10.00 2-5 20.00 6 10.00 7-year 7.14 2-7 14.29 CO 7.14 10-year 5.00 2-10 10.00 11 5.00 15-year 3.33 2-15 6.67 16 3.33 20-year 2.50 2-20 5.00 21 2.50 Note: The last two rows are used for qualified improvement property (15-year normal MACRS; 20-year ADS). Exhibit 5.8 ADS for Alternative Minimum Tax: 150% Declining-Balance for Personal Property Assuming Half-Year Convention (Percentage Rates) For Property Placed in Service after December 31, 1986 (Partial Table") Recovery 7-Year Year 3-Year 150% 5-Year 150% 150% 9.5-Year 150% 10-Year 150% 12-Year 150% 1 2 3 25.00 37.50 25.00** 12.50 15.00 25.50 17.85 16.66" 16.66 8.33 10.71 19.13 15.03 12.25" 12.25 12.25 12.25 6.13 7.89 14,54 12.25 10.31 9.17 4 5 6 7 8 9 10 11 12 13 7.50 13.88 11.79 10.02 8.74** 8.74 8.74 8.74 8.74 8.74 4.37 9.17 9.17 9.17 9.16 6.25 11.72 10.25 8.97 7.85 7.33** 7.33 7.33 7.33 7.33 7.32 7.33 3.66 Exhibit 5.9 ADS Straight-Line for Personal Property Assuming Half-Year Convention (Percentage Rates) For Property Placed in Service after December 31, 1986 (Partial Table Recovery Year 5-Year Class 10-Year Class 12-Year Class 10.00 5.00 4.17 20.00 10.00 8.33 3 20.00 10.00 8.33 20.00 10.00 8.33 5 20.00 10.0p 8.33 6 10.00 10.00 8.33 7 10.00 8.34 Exhibit 5.10 ADS Straight-Line for Real Property Assuming Mid-Month Convention (Percentage Rates) For Property Placed in Service after December 31, 2017; 30-Year Residential Rental Property Recovery Year 1 3 9 12 1 2-30 31 3.194 3.333 0.139 2.917 3.333 0417 2.639 3.333 0.694 2.361 3.333 0.972 Month Placed in Service 5 7 2.083 1.806 1.528 1.250 3.333 3.333 3.33) 1.250 1.528 1.805 2,083 0.972 3.333 2.361 10 0.694 3.333 2.639 11 0.417 3.333 2.917 0.139 3.333 3.194 For Property Placed in Service after December 31, 1986; 40-Year Nonresidential Real Property Recovery Month Placed in Service Year 1 2 4 7 9 1 2.396 2.188 1.979 1.771 1.563 1.354 1.146 0.729 2-40 2.500 2.500 2.500 2.500 2.500 2.500 Spoo 2.500 41 0.104 0.312 0.521 0.729 0.937 1.146 1.354 1.562 1.771 0.938 2.500 10 0.521 2.500 1.979 11 0.313 2.500 2.187 12 0.104 2.500 2.396