Answered step by step
Verified Expert Solution
Link Copied!

Question

1 Approved Answer

EXERCISE 6: BREAKEVEN ANALYSIS Breakeven Analysis allows you to assess how profitable a project will be based on how much you sell each unit for

image text in transcribed
EXERCISE 6: BREAKEVEN ANALYSIS Breakeven Analysis allows you to assess how profitable a project will be based on how much you sell each unit for and how many units you sell. In the following example, assume you own a small company that has developed a new exercise device-called "The Strider--that tells someone how far they have walked, how many calories they have burned and how many paces per mile they have tallied. Assume the following facts. The machine that makes the device was purchased for $11,500. The microprocessors, the plastic case materials and the labor needed to assemble it costs $15 for each device. You have decided to sell the product directly to the consumer through a website promoted through ads. The price you intend to charge each buyer for the "Strider" is $42. Before you market the product, you decide to create a spreadsheet to estimate the revenues, costs, profits and "Breakeven Point." Go to the "Excel_Homework and click on the tab/worksheet labeled "Breakeven Analysis." Create a breakeven analysis table for "The Strider" Note that the Breakeven Point is in units and should therefore be rounded. You should set up the spreadsheet with the appropriate formulas to change the price, cost and sales volume quickly. Answer the following questions: 1. What are your revenues, total expenses and profit if you sell 10,000 Striders? 2. How many Striders do you need to sell at $42 to break even? 3. What are your revenues, expenses and profit if you sell 15,000 Striders by lowering the price to $35 each? 4. How many Striders do you need to sell at $42 to make $500,000 in profits? (Find the answer by using the formula to calculate the profit, i.e., Profit - Revenue - Total Cost.) Type All Answers on your Excel Spreadsheet that you will submit 13 EXERCISE 7: CREATING A CLUSTERED COLUMN AND LINE CHART Chants

Step by Step Solution

There are 3 Steps involved in it

Step: 1

blur-text-image

Get Instant Access to Expert-Tailored Solutions

See step-by-step solutions with expert insights and AI powered tools for academic success

Step: 2

blur-text-image

Step: 3

blur-text-image

Ace Your Homework with AI

Get the answers you need in no time with our AI-driven, step-by-step assistance

Get Started

Recommended Textbook for

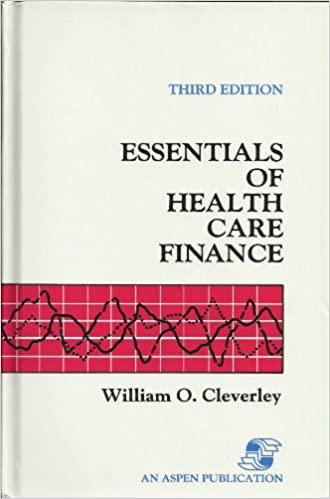
Essentials Of Health Care Finance

Authors: William O. Cleverley

3rd Edition

0834203413, 978-0834203419

More Books

Students also viewed these Finance questions

Question

given the data how would a bar double graph look?

Answered: 1 week ago