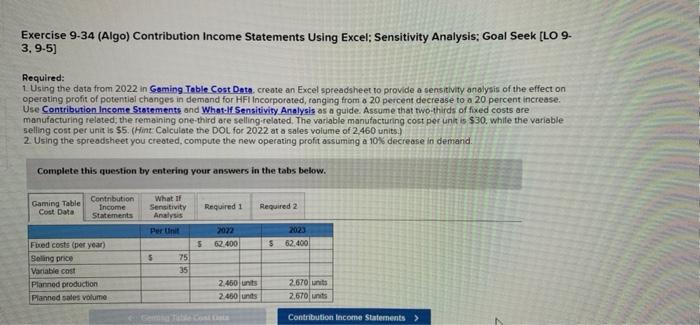
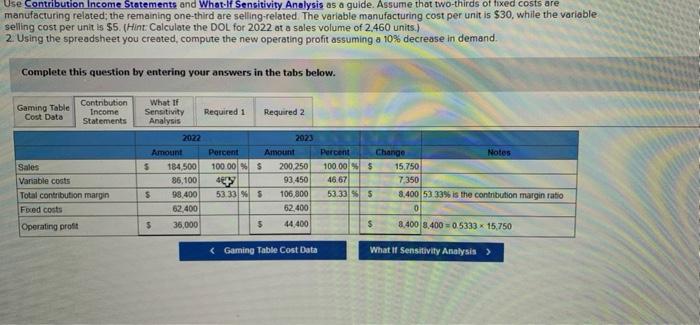
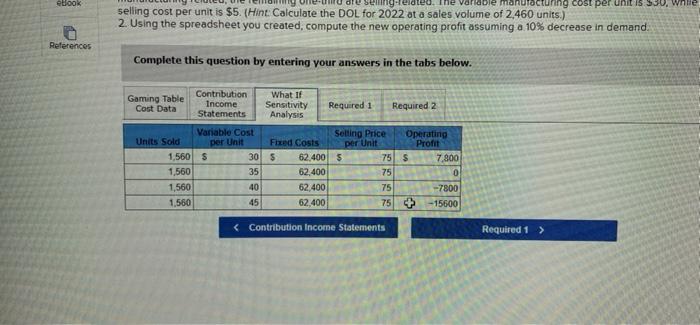
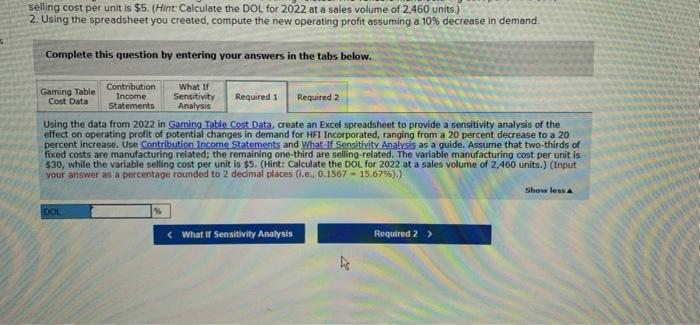
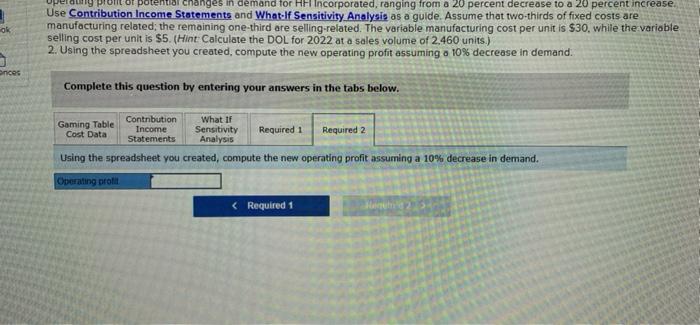
Exercise 9-34 (Algo) Contribution Income Statements Using Excel: Sensitivity Analysis: Goal Seek [LO 9- 3,9-5) Required: 1. Using the data from 2022 in Geming Table Cost Date create an Excel spreadsheet to provide a sensitivity analysis of the effect on operating profit of potential changes in demand for HFI Incorporated, ranging from a 20 percent decrease to a 20 percent increase. Use Contribution Income Statements and What If Sensitivity Analysis as a guide Assume that two-thirds of fixed costs are manufacturing related; the remaining one-third are selling.related. The variable manufacturing cost per unit is $30, whife the variable selling cost per unit is $5.(Hint Calculate the DOL for 2022 at a sales volume of 2,460 units.) 2. Using the spreadsheet you created, compute the new operating profit assuming a 10% decrease in demand Complete this question by entering your answers in the tabs below. Gaming Table CostData Contribution Income Statements What If Sensitivity Analysis Required 1 Required 2 Per Unit 2022 562.400 2023 62.400 $ $ Fred costs (per year) Selling price Variable cost Planned production Planned sales volume 75 35 2.460 units 2.460 und 2670 units 2,670 units Contribution Income Statements > Use Contribution Income Statements and What If Sensitivity Analysis as a guide. Assume that two-thirds of fixed costs are manufacturing related the remaining one-third are seling-related. The variable manufacturing cost per unit is $30, while the variable selling cost per unit is $5. (Hint: Calculate the DOL for 2022 at a sales volume of 2.460 units.) 2. Using the spreadsheet you created, compute the new operating profit assuming a 10% decrease in demand. Complete this question by entering your answers in the tabs below. Gaming Table Cost Data Contribution Income Statements Sales Variable costs Total contribution margin Foed costs What If Sensitivity Required 1 Required 2 Analysis 2022 2023 Amount Porcent Amount $ 184,500 100 00 $ 200.250 86,100 4 93.450 $ 98.400 53 33% 5 106.800 62.400 62.400 5 36,000 $ 44.400 Percent Change Notes 100.00 $ 15,750 46 67 7350 53.335 8.400 53.33% is the contribution margin ratio 0 s 8.400 8.400 = 0.5333 x 15.750 Operating profit ebook ne variable manufacturing cost per unit is 500, while selling cost per unit is $5. (Hint: Calculate the DOL for 2022 at a sales volume of 2,460 units.) 2. Using the spreadsheet you created, compute the new operating profit assuming a 10% decrease in demand References Complete this question by entering your answers in the tabs below. Gaming Table Contribution What if Cost Data Income Sensitivity Required 1 Required 2 Statements Analysis Variable Cost Selling Price Operating Units Sold per Unit Fixed Costs per Unit Profit 1,560 s 30$ 62.400 5 75 $ 7.800 1,560 35 62.400 75 0 1,560 40 62,400 75 -7800 1,560 45 62.400 75 4 -15600 selling cost per unit is $5. (Hint: Calculate the DOL for 2022 at a sales volume of 2.460 units.) 2. Using the spreadsheet you created, compute the new operating profit assuming a 10% decrease in demand Complete this question by entering your answers in the tabs below. Contribution Gaming Table What If Income Sensitivity Required 1 Cost Data Required 2 Statements Analysis Using the data from 2022 in Gaming Table Cost Data, create an Excel spreadsheet to provide a sensitivity analysis of the effect on operating profit of potential changes in demand for HFI Incorporated, ranging from a 20 percent decrease to a 20 percent increase. Use Contribution Income Statements and What If Sensitivity Analysis as a guide. Assume that two-thirds of fixed costs are manufacturing related; the remaining one-third are selling-related. The variable manufacturing cost per unit is $30, while the variable selling cost per unit is $5. (Hint: Calculate the DOL for 2022 at a sales volume of 2,460 units.) (Input your answer as a percentage rounded to 2 decimal places (l.e., 0.1567 - 15.67%).) Show less DOL * (What If Sensitivity Analysis Required 2 > . or potential changes in demand for HF Incorporated, ranging from a 20 percent decrease to a 20 percent increase. Use Contribution Income Statements and What If Sensitivity Analysis as a guide. Assume that two-thirds of fixed costs are manufacturing related the remaining one-third are selling-related. The variable manufacturing cost per unit is $30, while the variable selling cost per unit is $5. (Hint Calculate the DOL for 2022 at a sales volume of 2.460 units) 2. Using the spreadsheet you created, compute the new operating profit assuming a 10% decrease in demand. onces Complete this question by entering your answers in the tabs below. Contnbution Gaming Table What If Cost Data Income Sensitivity Required 1 Required 2 Statements Analysis Using the spreadsheet you created, compute the new operating profit assuming a 10% decrease in demand. Operating profil Use Contribution Income Statements and What If Sensitivity Analysis as a guide. Assume that two-thirds of fixed costs are manufacturing related the remaining one-third are seling-related. The variable manufacturing cost per unit is $30, while the variable selling cost per unit is $5. (Hint: Calculate the DOL for 2022 at a sales volume of 2.460 units.) 2. Using the spreadsheet you created, compute the new operating profit assuming a 10% decrease in demand. Complete this question by entering your answers in the tabs below. Gaming Table Cost Data Contribution Income Statements Sales Variable costs Total contribution margin Foed costs What If Sensitivity Required 1 Required 2 Analysis 2022 2023 Amount Porcent Amount $ 184,500 100 00 $ 200.250 86,100 4 93.450 $ 98.400 53 33% 5 106.800 62.400 62.400 5 36,000 $ 44.400 Percent Change Notes 100.00 $ 15,750 46 67 7350 53.335 8.400 53.33% is the contribution margin ratio 0 s 8.400 8.400 = 0.5333 x 15.750 Operating profit ebook ne variable manufacturing cost per unit is 500, while selling cost per unit is $5. (Hint: Calculate the DOL for 2022 at a sales volume of 2,460 units.) 2. Using the spreadsheet you created, compute the new operating profit assuming a 10% decrease in demand References Complete this question by entering your answers in the tabs below. Gaming Table Contribution What if Cost Data Income Sensitivity Required 1 Required 2 Statements Analysis Variable Cost Selling Price Operating Units Sold per Unit Fixed Costs per Unit Profit 1,560 s 30$ 62.400 5 75 $ 7.800 1,560 35 62.400 75 0 1,560 40 62,400 75 -7800 1,560 45 62.400 75 4 -15600 selling cost per unit is $5. (Hint: Calculate the DOL for 2022 at a sales volume of 2.460 units.) 2. Using the spreadsheet you created, compute the new operating profit assuming a 10% decrease in demand Complete this question by entering your answers in the tabs below. Contribution Gaming Table What If Income Sensitivity Required 1 Cost Data Required 2 Statements Analysis Using the data from 2022 in Gaming Table Cost Data, create an Excel spreadsheet to provide a sensitivity analysis of the effect on operating profit of potential changes in demand for HFI Incorporated, ranging from a 20 percent decrease to a 20 percent increase. Use Contribution Income Statements and What If Sensitivity Analysis as a guide. Assume that two-thirds of fixed costs are manufacturing related; the remaining one-third are selling-related. The variable manufacturing cost per unit is $30, while the variable selling cost per unit is $5. (Hint: Calculate the DOL for 2022 at a sales volume of 2,460 units.) (Input your answer as a percentage rounded to 2 decimal places (l.e., 0.1567 - 15.67%).) Show less DOL * (What If Sensitivity Analysis Required 2 > . or potential changes in demand for HF Incorporated, ranging from a 20 percent decrease to a 20 percent increase. Use Contribution Income Statements and What If Sensitivity Analysis as a guide. Assume that two-thirds of fixed costs are manufacturing related the remaining one-third are selling-related. The variable manufacturing cost per unit is $30, while the variable selling cost per unit is $5. (Hint Calculate the DOL for 2022 at a sales volume of 2.460 units) 2. Using the spreadsheet you created, compute the new operating profit assuming a 10% decrease in demand. onces Complete this question by entering your answers in the tabs below. Contnbution Gaming Table What If Cost Data Income Sensitivity Required 1 Required 2 Statements Analysis Using the spreadsheet you created, compute the new operating profit assuming a 10% decrease in demand. Operating profil