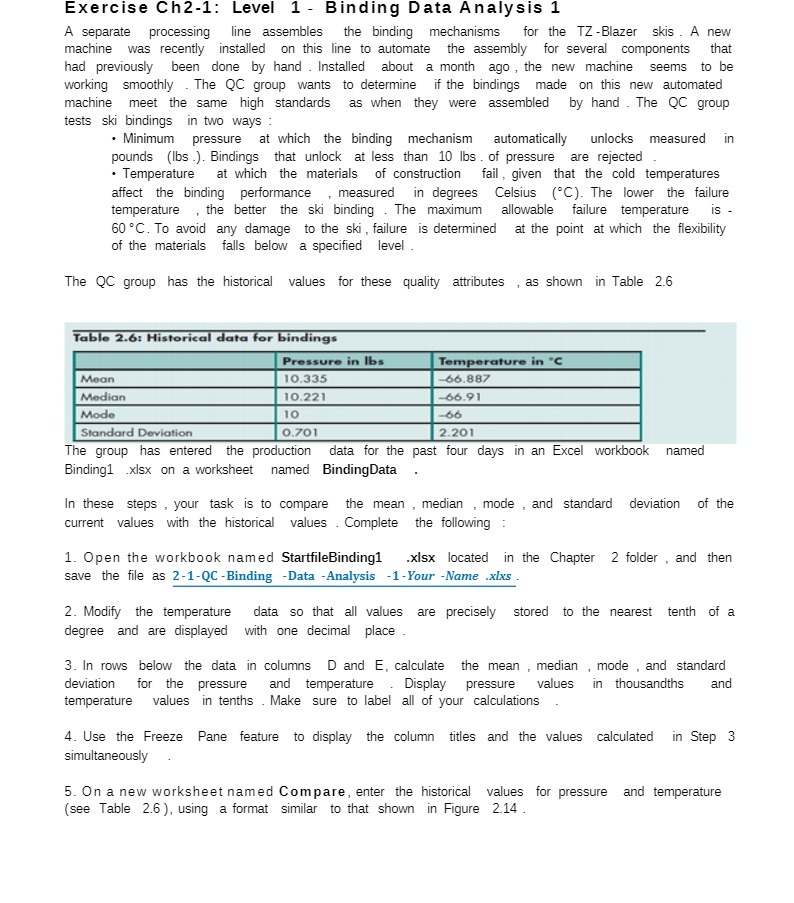
Exercise Ch2-1: Level 1 - Binding Data Analysis 1 A separate processing line assembles the binding mechanisms for the TZ -Blazer skis . A new machine was recently installed on this line to automate the assembly for several components that had previously been done by hand . Installed about a month ago , the new machine seems to be working smoothly . The QC group wants to determine if the bindings made on this new automated machine meet the same high standards as when they were assembled by hand . The QC group tests ski bindings in two ways : . Minimum pressure at which the binding mechanism automatically unlocks measured in pounds (lbs .). Bindings that unlock at less than 10 lbs . of pressure are rejected . Temperature at which the materials of construction fail , given that the cold temperatures affect the binding performance , measured in degrees Celsius ("C). The lower the failure temperature , the better the ski binding . The maximum allowable failure temperature is 60 "C. To avoid any damage to the ski , failure is determined at the point at which the flexibility of the materials falls below a specified level The QC group has the historical values for these quality attributes , as shown in Table 2.6 Table 2.6: Historical data for bindings Pressure in Ibs Temperature in "C Mean 10.335 -66.887 Median 10.221 -66.91 Mode 10 -66 Standard Deviation 0.701 2.201 The group has entered the production data for the past four days in an Excel workbook named Binding1 .xlsx on a worksheet named BindingData In these steps , your task is to compare the mean , median , mode , and standard deviation of the current values with the historical values . Complete the following 1. Open the workbook named StartfileBinding1 .xlsx located in the Chapter 2 folder , and then save the file as 2-1-QC -Binding -Data -Analysis -1-Your -Name .xlxs 2. Modify the temperature data so that all values are precisely stored to the nearest tenth of a degree and are displayed with one decimal place 3. In rows below the data in columns D and E, calculate the mean , median , mode , and standard deviation for the pressure and temperature Display pressure values in thousandths and temperature values in tenths . Make sure to label all of your calculations 4. Use the Freeze Pane feature to display the column titles and the values calculated in Step 3 simultaneously 5. On a new worksheet named Compare, enter the historical values for pressure and temperature (see Table 2.6 ), using a format similar to that shown in Figure 2.14