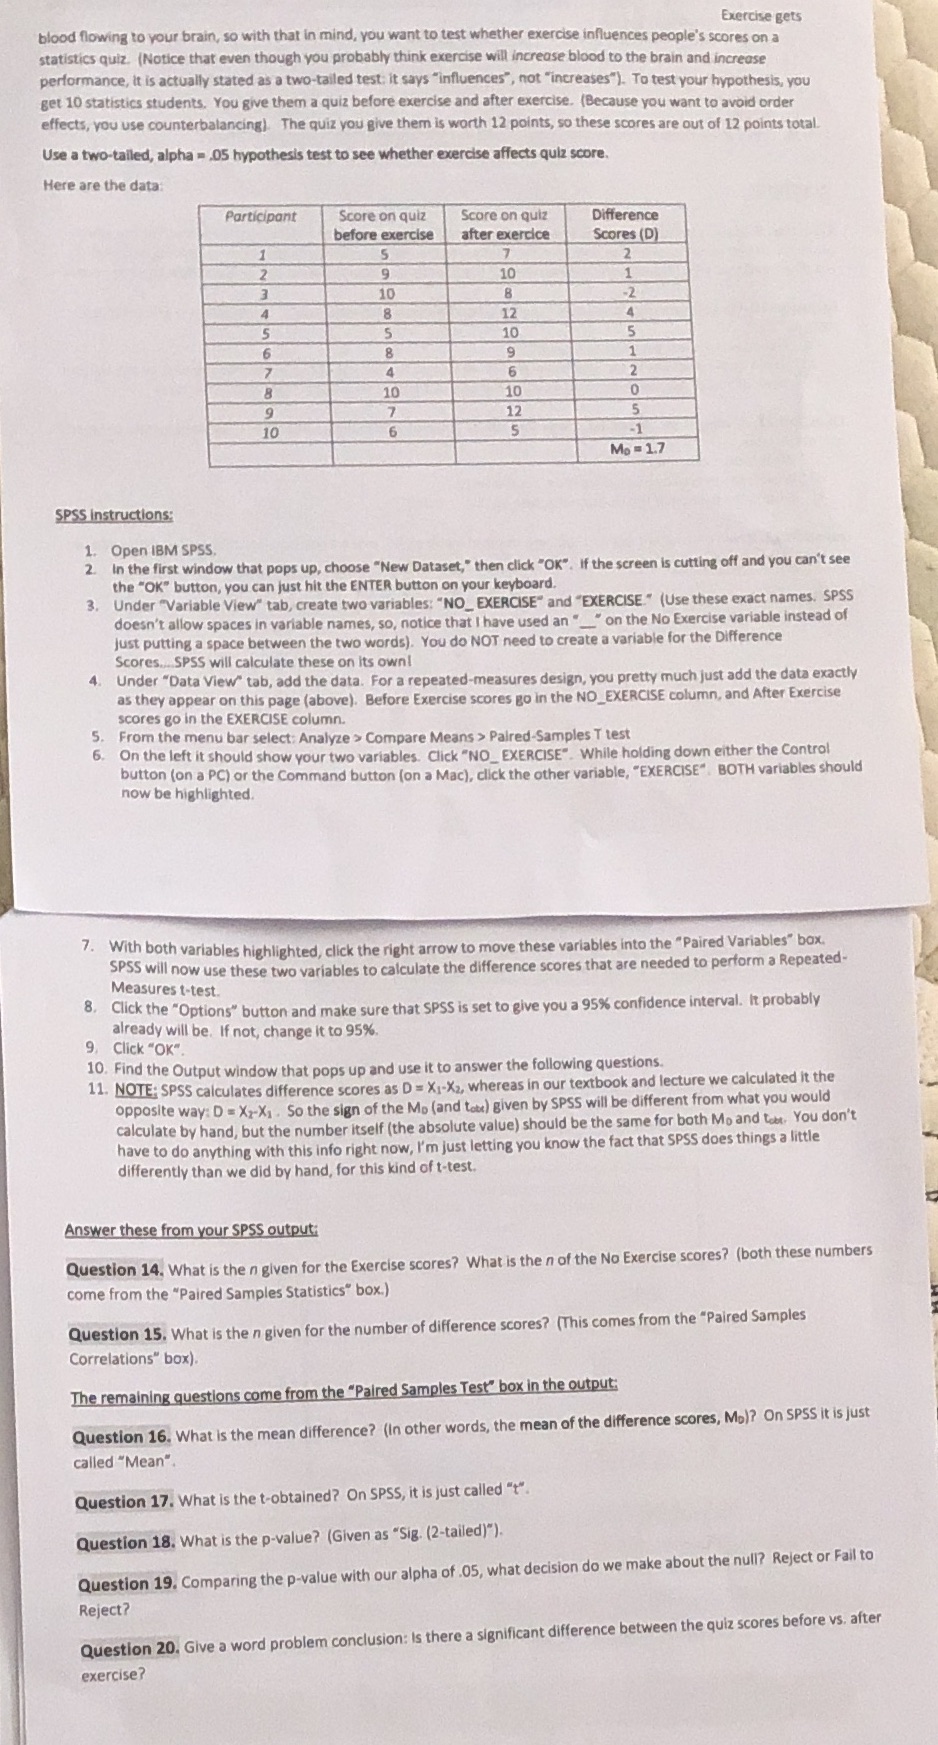
Exercise gets blood flowing to your brain, so with that in mind, you want to test whether exercise influences people's scores on a statistics quiz. (Notice that even though you probably think exercise will increase blood to the brain and increase performance, it is actually stated as a two-tailed test: it says "influences", not "increases"). To test your hypothesis, you get 10 statistics students. You give them a quiz before exercise and after exercise. (Because you want to avoid order effects, you use counterbalancing). The quiz you give them is worth 12 points, so these scores are out of 12 points total. Use a two-tailed, alpha = .05 hypothesis test to see whether exercise affects quiz score. Here are the data: Participant Score on quiz Score on quiz Difference before exercise after exercice Scores (D) 1 5 2 9 10 10 8 -2 4 8 12 5 10 5 8 9 4 6 10 10 0 12 10 5 -1 Mo = 1.7 SPSS instructions: 1. Open IBM SPSS. 2. In the first window that pops up, choose "New Dataset," then click "OK". If the screen is cutting off and you can't see the "OK" button, you can just hit the ENTER button on your keyboard. 3. Under "Variable View" tab, create two variables: "NO_ EXERCISE" and "EXERCISE." (Use these exact names. SPSS doesn't allow spaces in variable names, so, notice that I have used an "_" on the No Exercise variable instead of just putting a space between the two words). You do NOT need to create a variable for the Difference Scores..SPSS will calculate these on its own! Under "Data View" tab, add the data. For a repeated-measures design, you pretty much just add the data exactly as they appear on this page (above). Before Exercise scores go in the NO_EXERCISE column, and After Exercise scores go in the EXERCISE column. 5. From the menu bar select: Analyze > Compare Means > Paired-Samples T test 6. On the left it should show your two variables. Click "NO_ EXERCISE". While holding down either the Control button (on a PC) or the Command button (on a Mac), click the other variable, "EXERCISE". BOTH variables should now be highlighted. 7. With both variables highlighted, click the right arrow to move these variables into the "Paired Variables" box. will now use these two variables to calculate the difference scores that are needed to perform a Repeated- Measures t-test. 8. Click the "Options" button and make sure that SPSS is set to give you a 95% confidence interval. It probably already will be. If not, change it to 95%. 9. Click "OK". 10. Find the Output window that pops up and use it to answer the following questions. 11. NOTE; SPSS calculates difference scores as D = X1-Xz, whereas in our textbook and lecture we calculated it the opposite way: D = Xx-X1 . So the sign of the Mo (and tot) given by SPSS will be different from what you would calculate by hand, but the number itself (the absolute value) should be the same for both Mo and tok. You don't have to do anything with this info right now, I'm just letting you know the fact that SPSS does things a little differently than we did by hand, for this kind of t-test. Answer these from your SPSS output Question 14. What is the n given for the Exercise scores? What is the n of the No Exercise scores? (both these numbers come from the "Paired Samples Statistics" box.) Question 15. What is the n given for the number of difference scores? (This comes from the "Paired Samples Correlations" box). The remaining questions come from the "Paired Samples Test" box in the output: Question 16. What is the mean difference? (In other words, the mean of the difference scores, Mo)? On SPSS it is just called "Mean". Question 17. What is the t-obtained? On SPSS, it is just called "t". Question 18. What is the p-value? (Given as "Sig. (2-tailed)"). Question 19. Comparing the p-value with our alpha of .05, what decision do we make about the null? Reject or Fail to Reject? Question 20. Give a word problem conclusion: Is there a significant difference between the quiz scores before vs. after exercise