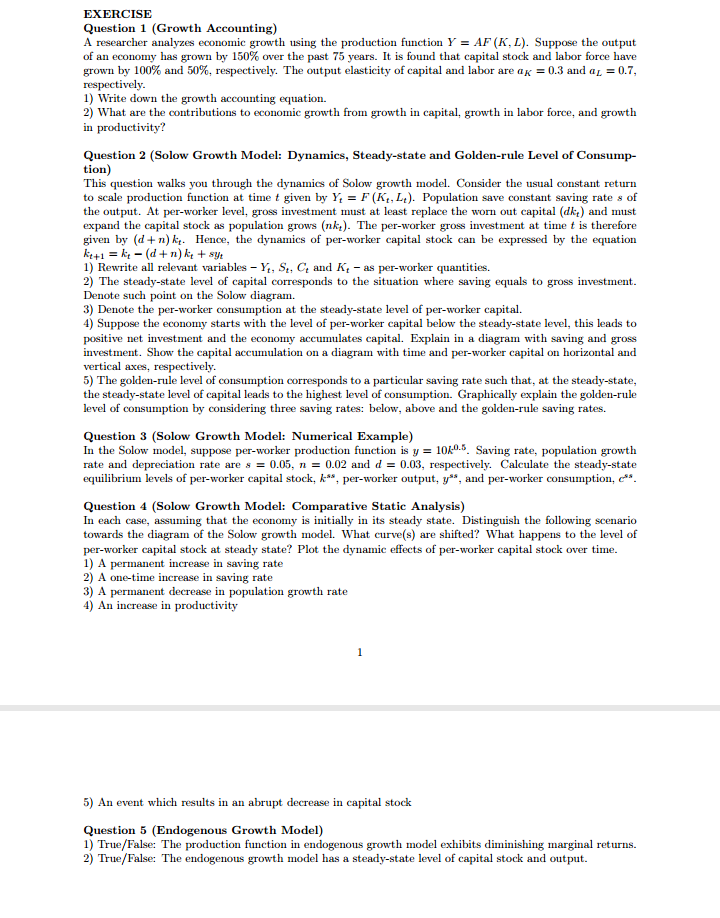

EXERCISE Question 1 (Growth Accounting) A researcher analyzes economic growth using the production function Y = AF (K, L). Suppose the output of an economy has grown by 150% over the past 75 years. It is found that capital stock and labor force have grown by 100% and 50%, respectively. The output elasticity of capital and labor are ax = 0.3 and ay = 0.7, respectively. 1) Write down the growth accounting equation. 2) What are the contributions to economic growth from growth in capital, growth in labor force, and growth in productivity? Question 2 (Solow Growth Model: Dynamics, Steady-state and Golden-rule Level of Consump- tion) This question walks you through the dynamics of Solow growth model. Consider the usual constant return to scale production function at time { given by Yr = F (Kr, L,). Population save constant saving rate s of the output. At per-worker level, gross investment must at least replace the worn out capital (dk, ) and must expand the capital stock as population grows (nk,). The per-worker gross investment at time t is therefore given by (d + n) k. Hence, the dynamics of per-worker capital stock can be expressed by the equation ke+1 = ke - (d + n) k, + sy 1) Rewrite all relevant variables - Yr, St, C, and Kr - as per-worker quantities. 2) The steady-state level of capital corresponds to the situation where saving equals to gross investment. Denote such point on the Solow diagram. 3) Denote the per-worker consumption at the steady-state level of per-worker capital. 1) Suppose the economy starts with the level of per-worker capital below the steady-state level, this leads to positive net investment and the economy accumulates capital. Explain in a diagram with saving and gross investment. Show the capital accumulation on a diagram with time and per-worker capital on horizontal and vertical axes, respectively. 5) The golden-rule level of consumption corresponds to a particular saving rate such that, at the steady-state, the steady-state level of capital leads to the highest level of consumption. Graphically explain the golden-rule level of consumption by considering three saving rates: below, above and the golden-rule saving rates. Question 3 (Solow Growth Model: Numerical Example) In the Solow model, suppose per-worker production function is y = 1040-. Saving rate, population growth rate and depreciation rate are s = 0.05, n = 0.02 and d = 0.03, respectively. Calculate the steady-state equilibrium levels of per-worker capital stock, ", per-worker output, y", and per-worker consumption, ". Question 4 (Solow Growth Model: Comparative Static Analysis) In each case, assuming that the economy is initially in its steady state. Distinguish the following scenario towards the diagram of the Solow growth model. What curve(s) are shifted? What happens to the level of per-worker capital stock at steady state? Plot the dynamic effects of per-worker capital stock over time. 1) A permanent increase in saving rate 2) A one-time increase in saving rate 3) A permanent decrease in population growth rate 4) An increase in productivity 5) An event which results in an abrupt decrease in capital stock Question 5 (Endogenous Growth Model) 1) True/False: The production function in endogenous growth model exhibits diminishing marginal returns. 2) True/False: The endogenous growth model has a steady-state level of capital stock and output.6. Consider an economy with 500 people in the labor force. At the beginning of every month, 5 people lose their jobs and remain unemployed for exactly one month; one month later, they find new jobs and become employed. Furthermore, on January 1 of each year, 20 people lose their jobs and remain unemployed for six months before finding new jobs. Finally, on July 1 of each year, 20 people lose their jobs and remain unemployed for six months before finding new jobs. What is the average duration of an unemployment spell?8. In the Solow growth model, suppose initially that the economy is in its steady state, in which the saving rate is lower than the golden-rule saving rate. Suppose the saving rate is changed to the golden-rule saving rate, which of the following is true for the effect on consumption per worker? a. Consumption per worker is always higher than the initial steady-state level of consumption in both transition path and the new steady state.4. lConsider a version of the Solow growth model in which output at time t is determined by the production function 1"; = EEK: + 0.8L. The depn'eciation is given by d'}, where the depreciation rate is d = 112. Saving is given by 315. where the saving rate is s = 0.5. Assume that population L is constant, i.e. does not grow with time. Calculate the steady state capital per person, it\". Also, calculate the steady state output per person and oonsuntption per person, 4' and r", respectively. Part III. Solow Model of Growth Suppose that the production function is given by Y=0.5 KV/N. Assume that the size of the population, the participation rate, and the unemployment rate are all constant. 1. Is this production function characterized by constant returns to scale? Explain. 2. Transform the production function into a relationship between output per worker and capital per worker. 3. Derive the steady state level of capital per worker in terms of the saving rate (s) and the depreciation rate ( 6 ). 4. Derive the equations for steady-state output per worker and steady-state consumption per worker in terms of s and o . 5. Let 6 =0.08 and s = 0.16. Calculate the steady-state output per worker, capital per worker, and consumption per worker. 6. Let 6 =0.08 and s = 0.32. Calculate the steady-state output per worker, capital per worker, and consumption per worker. 7. What is the effect of an increase in the saving rate on output per worker over time? Show the transition from so to si graphically. 8. Explain what happens to the level of output per worker and the growth of output per worker when the saving rate increases from so to $1