Answered step by step
Verified Expert Solution
Question
1 Approved Answer
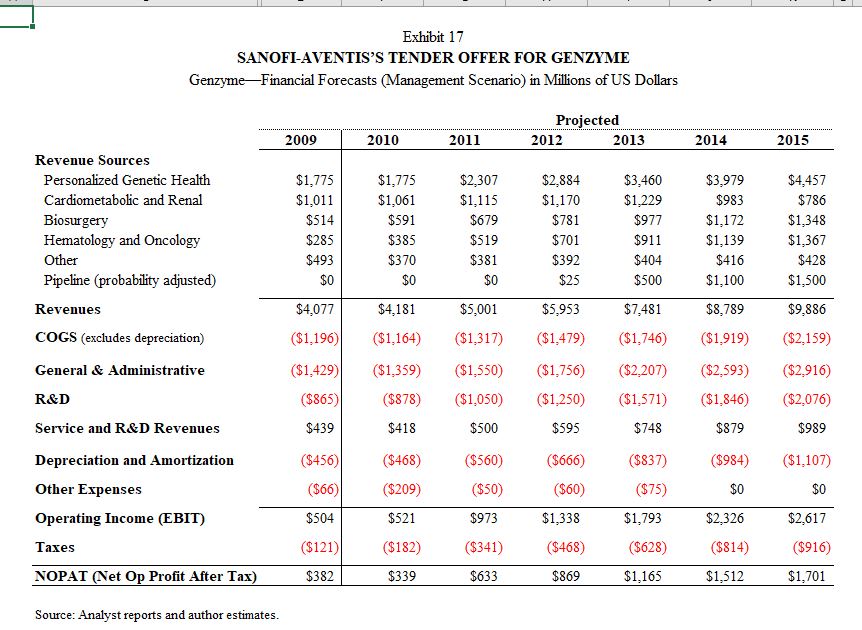
Exhibit 17 SANOFI-AVENTIS'S TENDER OFFER FOR GENZYME Genzyme Financial Forecasts (Management Scenario) in Millions of US Dollars Revenue Sources Personalized Genetic Health Cardiometabolic and


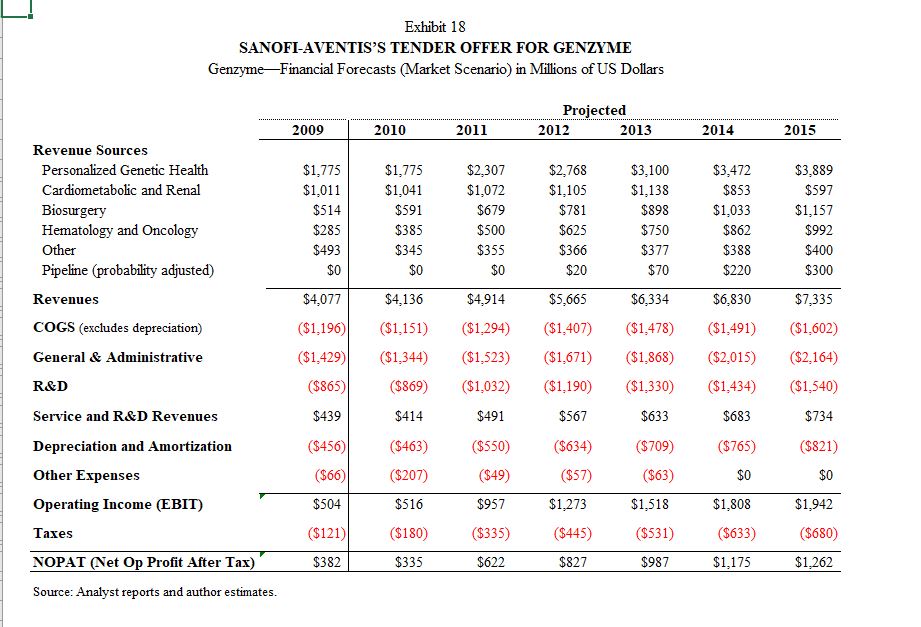
Exhibit 17 SANOFI-AVENTIS'S TENDER OFFER FOR GENZYME Genzyme Financial Forecasts (Management Scenario) in Millions of US Dollars Revenue Sources Personalized Genetic Health Cardiometabolic and Renal Biosurgery Hematology and Oncology Other Pipeline (probability adjusted) Revenues COGS (excludes depreciation) General & Administrative R&D Service and R&D Revenues Depreciation and Amortization Other Expenses Operating Income (EBIT) Taxes NOPAT (Net Op Profit After Tax) Source: Analyst reports and author estimates. 2009 $1,775 $1,011 $514 $285 $493 $0 2010 $1,775 $1,061 $591 $385 $370 $0 $4,077 $4,181 ($1,196) ($1,164) ($456) ($66) $504 ($121) $382 ($1,429) ($1,359) ($865) $439 2011 ($468) ($209) $521 ($182) $339 $2,307 $1,115 $679 $519 $381 $0 Projected ($560) ($50) $973 2012 ($1,550) ($1,756) ($878) ($1,050) ($1,250) $418 $500 $595 ($341) $633 $2,884 $1,170 $5,001 $5,953 ($1,317) ($1,479) $781 $701 $392 $25 ($666) ($60) $1,338 ($468) $869 2013 $3,460 $1,229 $977 $911 $404 $500 $7,481 ($1,746) ($837) ($75) ($2,207) ($2,593) ($1,571) ($1,846) $748 $879 $1,793 ($628) 2014 $1,165 $3,979 $983 $1,172 $1,139 $416 $1,100 $8,789 ($1,919) ($984) $0 $2,326 ($814) $1,512 2015 $4,457 $786 $1,348 $1,367 $428 $1,500 $9,886 ($2,159) ($2,916) ($2,076) $989 ($1,107) $0 $2,617 ($916) $1,701 Exhibit 18 SANOFI-AVENTIS'S TENDER OFFER FOR GENZYME Genzyme-Financial Forecasts (Market Scenario) in Millions of US Dollars Projected Revenue Sources Personalized Genetic Health Cardiometabolic and Renal Biosurgery Hematology and Oncology Other Pipeline (probability adjusted) Revenues COGS (excludes depreciation) General & Administrative R&D Service and R&D Revenues Depreciation and Amortization Other Expenses Operating Income (EBIT) Taxes NOPAT (Net Op Profit After Tax) Source: Analyst reports and author estimates. 2009 $1,775 $1,011 $514 $285 $493 $0 $4,077 ($1,196) ($1,429) ($865) $439 ($456) ($66) $504 ($121) $382 2010 $1,775 $1,041 $591 $385 $345 $0 $4,136 ($1,151) ($1,344) ($869) $414 ($463) ($207) $516 ($180) $335 2011 2012 $2,307 $1,072 $679 $500 $355 $0 $2,768 $1,105 $781 $625 $366 $20 $4,914 $5,665 ($1.294) ($1,407) ($1,523) ($1,671) ($1,032) ($1,190) $491 $567 ($550) ($634) ($49) ($57) $957 ($335) $622 $1,273 ($445) $827 2013 $3,100 $1,138 $898 $750 $377 $70 $6,334 ($1,478) ($1,868) ($1,330) $633 ($709) ($63) $1,518 ($531) $987 2014 $3,472 $853 $1,033 $862 $388 $220 $6,830 ($1,491) ($2,015) ($1,434) $683 ($765) $0 $1,808 ($633) $1,175 2015 $3,889 $597 $1,157 $992 $400 $300 $7,335 ($1,602) ($2,164) ($1,540) $734 ($821) $0 $1,942 ($680) $1,262 Using Management's NOPAT projections in Exhibit 17, estimate the free cash flows for 2010 through 2015. Do the same for Exhibit 18. How do the two cash flows compare?
Step by Step Solution
There are 3 Steps involved in it
Step: 1
To estimate the free cash flows for 2010 through 2015 using the NOPAT projections from Exhibit 17 an...
Get Instant Access to Expert-Tailored Solutions
See step-by-step solutions with expert insights and AI powered tools for academic success
Step: 2

Step: 3

Ace Your Homework with AI
Get the answers you need in no time with our AI-driven, step-by-step assistance
Get Started


