

Answered step by step
Verified Expert Solution
Question
1 Approved Answer
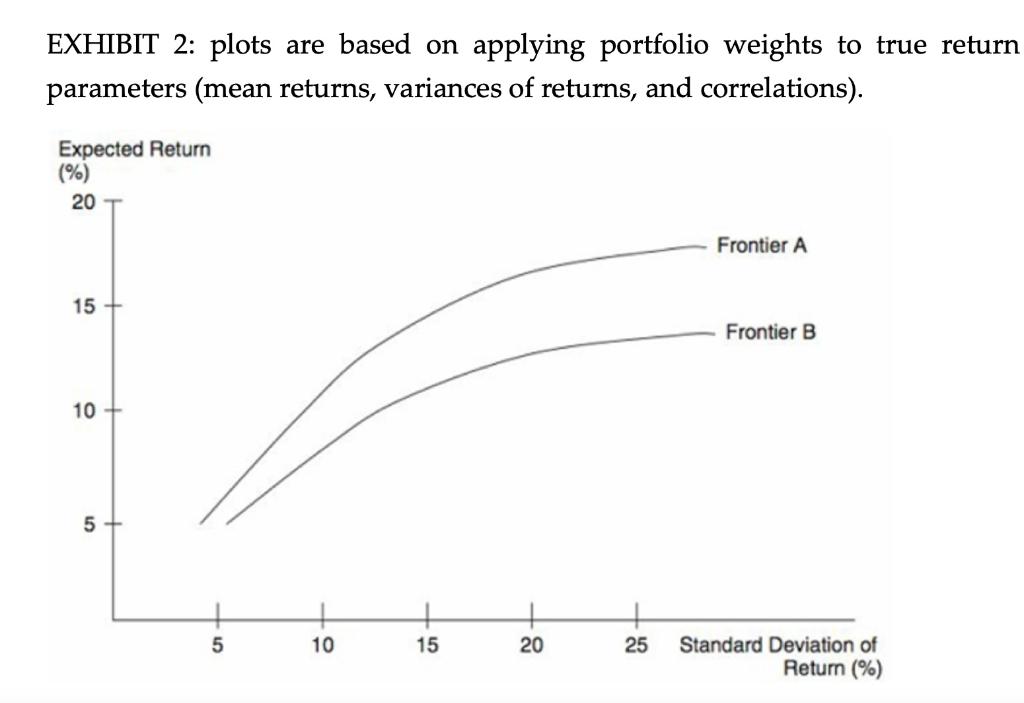
EXHIBIT 2: plots are based on applying portfolio weights to true return parameters (mean returns, variances of returns, and correlations). Expected Return (%) 20 Frontier
Step by Step Solution
There are 3 Steps involved in it
Step: 1

Get Instant Access to Expert-Tailored Solutions
See step-by-step solutions with expert insights and AI powered tools for academic success
Step: 2

Step: 3
Ace Your Homework with AI
Get the answers you need in no time with our AI-driven, step-by-step assistance
Get Started
Measuring And Analysing The Generational Economy National Transfer Accounts Manual
Authors: United Nations
1st Edition
9211515033,9210562836