Answered step by step
Verified Expert Solution
Question
1 Approved Answer
EXHIBIT 3.6 Operating and Nonoperating Items in Boston Scientific's Income Statement For Year Ended December 31, S millions 2018 2017 2016 Net sales $9,823 $9,048
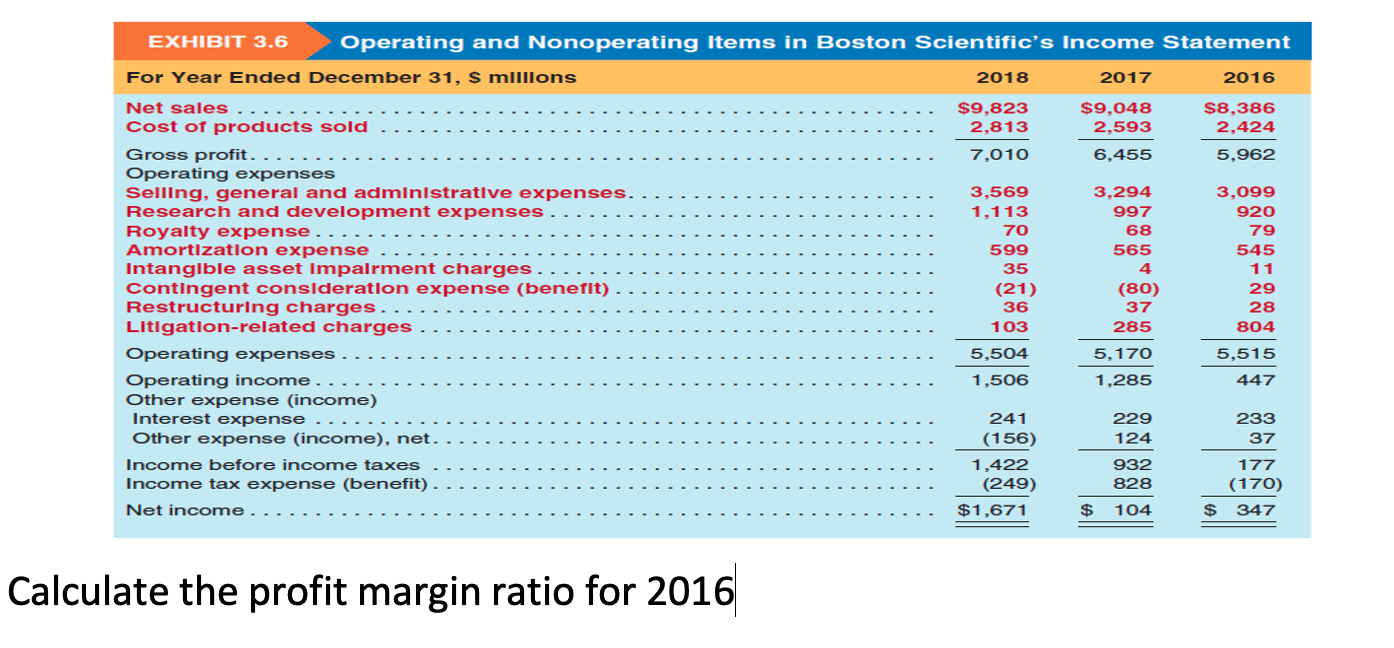
EXHIBIT 3.6 Operating and Nonoperating Items in Boston Scientific's Income Statement For Year Ended December 31, S millions 2018 2017 2016 Net sales $9,823 $9,048 $8,386 Cost of products sold 2,813 2,593 2,424 Gross profit. 7,010 6,455 5,962 Operating expenses Selling, general and administrative expenses. 3,569 3,294 3,099 Research and development expenses 1,113 997 920 Royalty expense 70 68 79 Amortization expense 599 565 545 Intangible asset Impalrment charges 35 4 11 Contingent consideration expense (benefit) (21) (80) 29 Restructuring charges. 36 37 28 Litigation-related charges 103 285 804 Operating expenses 5,504 5,170 5,515 Operating income 1,506 1,285 447 Other expense (income) Interest expense 241 229 233 Other expense (income), net. (156) 124 37 Income before income taxes 1.422 932 177 Income tax expense (benefit). (249) 828 (170) Net income $1,671 $ 104 $ 347 Calculate the profit margin ratio for 2016
Step by Step Solution
There are 3 Steps involved in it
Step: 1
Get Instant Access to Expert-Tailored Solutions
See step-by-step solutions with expert insights and AI powered tools for academic success
Step: 2
Step: 3
Ace Your Homework with AI
Get the answers you need in no time with our AI-driven, step-by-step assistance
Get Started