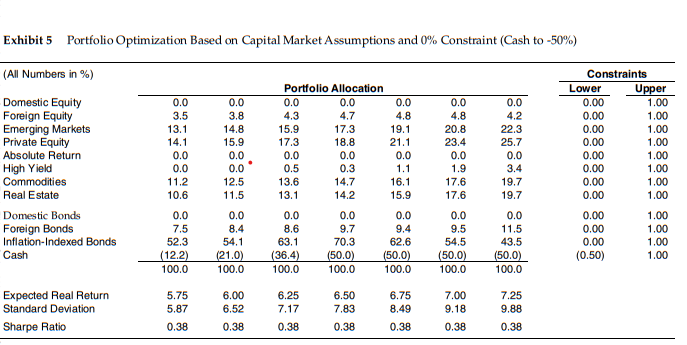
- Exhibit 5 shows the results of portfolio optimizations with all the asset classes including TIPS. The only constraints on the assets class allocations are no short selling except for cash where the lower limit is -50%. Comment on the portfolio allocations to the different asset classes and how practical they would be in practice. Hint: the endowment has over $15 billion in the year 2000.

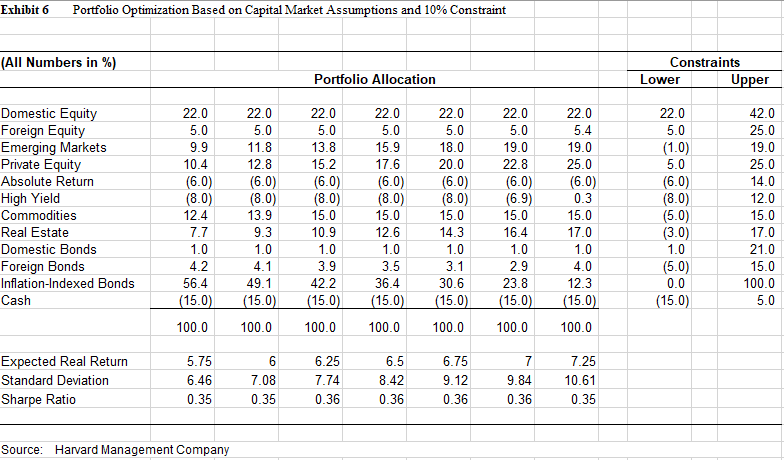
2. Exhibit 6 shows the results of portfolio optimizations with all the asset classes including TIPS but with the boards pre-established constraints on the asset allocations for each asset class, except TIPS. Comment on the portfolio allocations to the different asset classes and how they compare to the constraint limits. Once again, comment on how practical these allocations would be.

Exhibit 5 Portfolio Optimization Based on Capital Market Assumptions and 0% Constraint (Cash to -50%) (All Numbers in %) Portfolio Allocation Lower 0.0 0.0 0.0 0.0 0.0 0.0 0.0 0.00 3.5 3.8 4.3 4.7 4.8 4.8 4.2 0.00 Domestic Equity Foreign Equity Emerging Markets Private Equity 14.8 15.9 17.3 19.1 20.8 22.3 0.00 15.9 17.3 18.8 21.1 23.4 25.7 0.00 Absolute Return 0.0 0.0 0.0 0.0 0.0 0.0 0.00 0.0 0.5 0.3 1.1 1.9 3.4 0.00 High Yield Commodities 12.5 13.6 14.7 16.1 17.6 19.7 0.00 Real Estate 11.5 13.1 14.2 15.9 17.6 19.7 0.00 0.0 0.0 0.0 0.0 0.0 0.0 0.00 Domestic Bonds Foreign Bonds 8.4 8.6 9.7 9.4 9.5 11.5 0.00 54.1 63.1 70.3 62.6 54.5 43.5 0.00 Inflation-Indexed Bonds Cash (21.0) (36.4) (50.0) (50.0) (50.0) (50.0) (0.50) 100.0 100.0 100.0 100.0 100.0 100.0 6.00 6.25 6.50 6.75 7.00 7.25 Expected Real Return Standard Deviation 6.52 7.17 7.83 8.49 9.18 9.88 Sharpe Ratio 0.38 0.38 0.38 0.38 0.38 0.38 13.1 14.1 0.0 0.0 11.2 10.6 0.0 7.5 52.3 (12.2) 100.0 5.75 5.87 0.38 Constraints Upper 1.00 1.00 1.00 1.00 1.00 1.00 1.00 1.00 1.00 1.00 1.00 1.00 Exhibit 6 Portfolio Optimization Based on Capital Market Assumptions and 10% Constraint (All Numbers in %) Portfolio Allocation 22.0 22.0 22.0 22.0 22.0 5.0 5.0 5.0 5.0 5.0 9.9 11.8 13.8 15.9 19.0 Domestic Equity Foreign Equity Emerging Markets Private Equity Absolute Return High Yield Commodities 10.4 12.8 15.2 17.6 22.8 (6.0) (6.0) (6.0) (8.0) (8.0) (6.9) 12.4 15.0 Real Estate 7.7 10.9 Domestic Bonds 1.0 1.0 Foreign Bonds 4.2 4.1 3.9 56.4 49.1 42.2 Inflation-Indexed Bonds Cash (15.0) (15.0) (15.0) 100.0 Expected Real Return 5.75 6.46 Standard Deviation Sharpe Ratio 0.35 Source: Harvard Management Company 609 22.0 5.0 18.0 20.0 (6.0) (6.0) (8.0) (8.0) 15.0 15.0 15.0 12.6 14.3 16.4 1.0 1.0 1.0 3.5 3.1 2.9 36.4 30.6 23.8 (15.0) (15.0) (15.0) 100.0 100.0 100.0 100.0 100.0 6 6.25 6.5 6.75 7 7.08 7.74 8.42 9.12 9.84 0.35 0.36 0.36 0.36 0.36 (6.0) (8.0) 13.9 9.3 1.0 22.0 5.4 19.0 25.0 (6.0) 0.3 15.0 17.0 1.0 4.0 12.3 (15.0) 100.0 7.25 10.61 0.35 Constraints Lower 22.0 5.0 (1.0) 5.0 (6.0) (8.0) (5.0) (3.0) 1.0 (5.0) 0.0 (15.0) Upper 42.0 25.0 19.0 25.0 14.0 12.0 15.0 17.0 21.0 15.0 100.0 5.0 Exhibit 5 Portfolio Optimization Based on Capital Market Assumptions and 0% Constraint (Cash to -50%) (All Numbers in %) Portfolio Allocation Lower 0.0 0.0 0.0 0.0 0.0 0.0 0.0 0.00 3.5 3.8 4.3 4.7 4.8 4.8 4.2 0.00 Domestic Equity Foreign Equity Emerging Markets Private Equity 14.8 15.9 17.3 19.1 20.8 22.3 0.00 15.9 17.3 18.8 21.1 23.4 25.7 0.00 Absolute Return 0.0 0.0 0.0 0.0 0.0 0.0 0.00 0.0 0.5 0.3 1.1 1.9 3.4 0.00 High Yield Commodities 12.5 13.6 14.7 16.1 17.6 19.7 0.00 Real Estate 11.5 13.1 14.2 15.9 17.6 19.7 0.00 0.0 0.0 0.0 0.0 0.0 0.0 0.00 Domestic Bonds Foreign Bonds 8.4 8.6 9.7 9.4 9.5 11.5 0.00 54.1 63.1 70.3 62.6 54.5 43.5 0.00 Inflation-Indexed Bonds Cash (21.0) (36.4) (50.0) (50.0) (50.0) (50.0) (0.50) 100.0 100.0 100.0 100.0 100.0 100.0 6.00 6.25 6.50 6.75 7.00 7.25 Expected Real Return Standard Deviation 6.52 7.17 7.83 8.49 9.18 9.88 Sharpe Ratio 0.38 0.38 0.38 0.38 0.38 0.38 13.1 14.1 0.0 0.0 11.2 10.6 0.0 7.5 52.3 (12.2) 100.0 5.75 5.87 0.38 Constraints Upper 1.00 1.00 1.00 1.00 1.00 1.00 1.00 1.00 1.00 1.00 1.00 1.00 Exhibit 6 Portfolio Optimization Based on Capital Market Assumptions and 10% Constraint (All Numbers in %) Portfolio Allocation 22.0 22.0 22.0 22.0 22.0 5.0 5.0 5.0 5.0 5.0 9.9 11.8 13.8 15.9 19.0 Domestic Equity Foreign Equity Emerging Markets Private Equity Absolute Return High Yield Commodities 10.4 12.8 15.2 17.6 22.8 (6.0) (6.0) (6.0) (8.0) (8.0) (6.9) 12.4 15.0 Real Estate 7.7 10.9 Domestic Bonds 1.0 1.0 Foreign Bonds 4.2 4.1 3.9 56.4 49.1 42.2 Inflation-Indexed Bonds Cash (15.0) (15.0) (15.0) 100.0 Expected Real Return 5.75 6.46 Standard Deviation Sharpe Ratio 0.35 Source: Harvard Management Company 609 22.0 5.0 18.0 20.0 (6.0) (6.0) (8.0) (8.0) 15.0 15.0 15.0 12.6 14.3 16.4 1.0 1.0 1.0 3.5 3.1 2.9 36.4 30.6 23.8 (15.0) (15.0) (15.0) 100.0 100.0 100.0 100.0 100.0 6 6.25 6.5 6.75 7 7.08 7.74 8.42 9.12 9.84 0.35 0.36 0.36 0.36 0.36 (6.0) (8.0) 13.9 9.3 1.0 22.0 5.4 19.0 25.0 (6.0) 0.3 15.0 17.0 1.0 4.0 12.3 (15.0) 100.0 7.25 10.61 0.35 Constraints Lower 22.0 5.0 (1.0) 5.0 (6.0) (8.0) (5.0) (3.0) 1.0 (5.0) 0.0 (15.0) Upper 42.0 25.0 19.0 25.0 14.0 12.0 15.0 17.0 21.0 15.0 100.0 5.0


