

Answered step by step
Verified Expert Solution
Question
1 Approved Answer
Exhibit 5.26 presents risk ratios for Walmart for 2014 and 2013. Exhibits 1.19,1.20 and 1.21 in Chapter 1 present the financial statements for Walmart. Exhibit
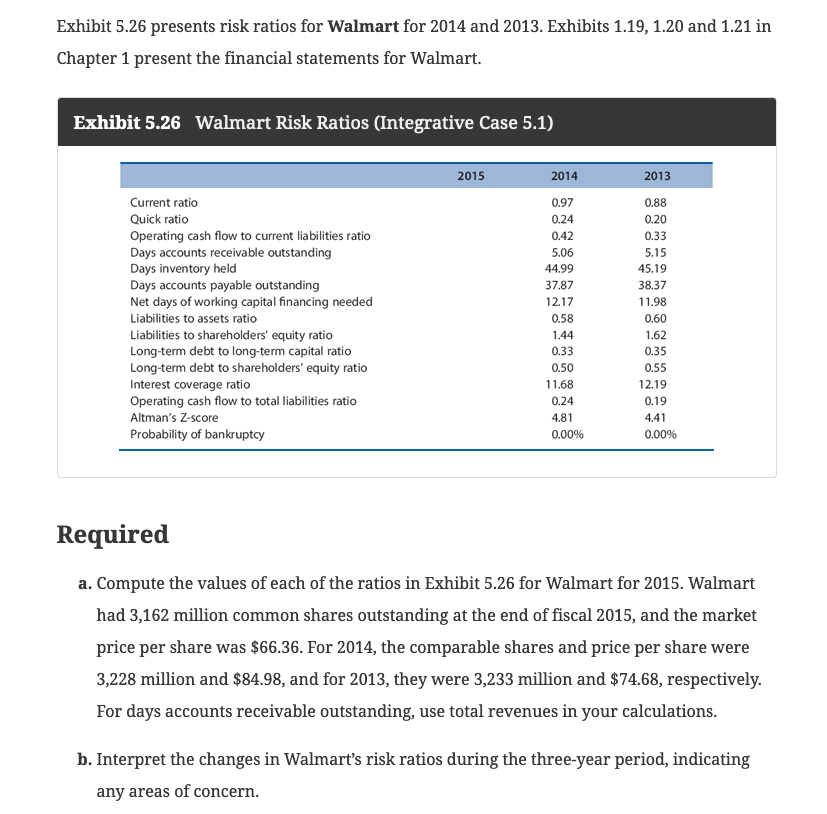
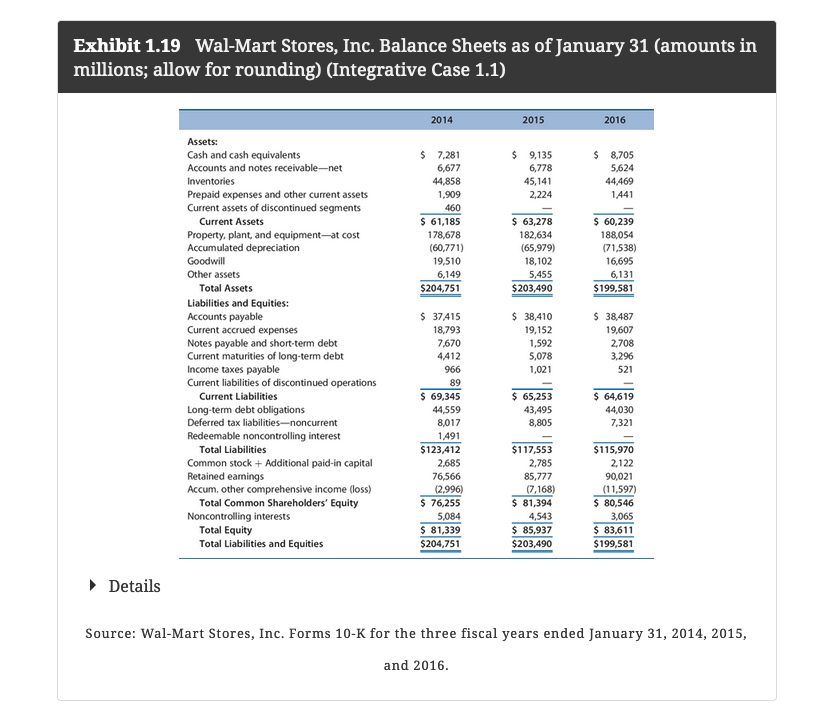
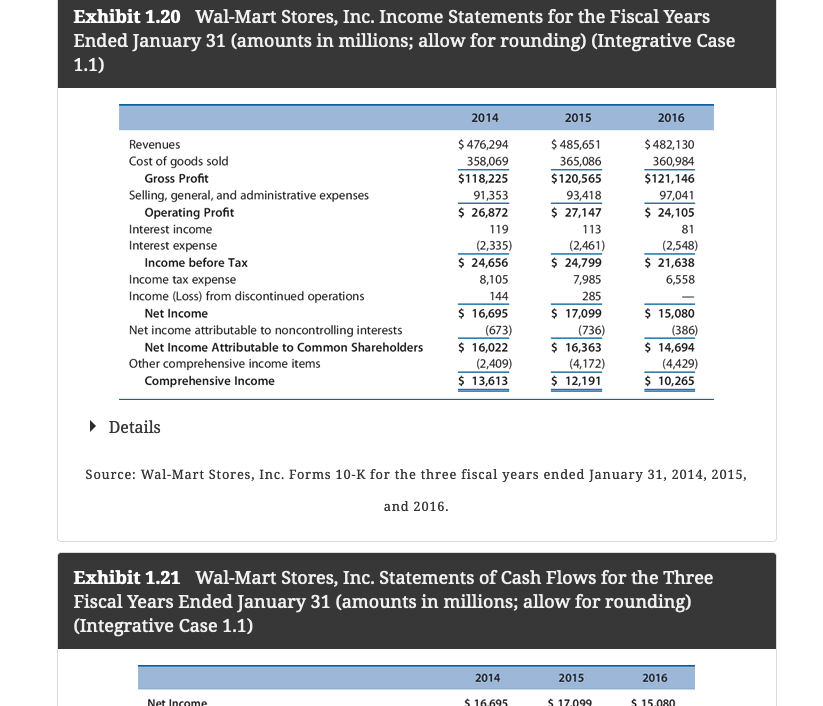
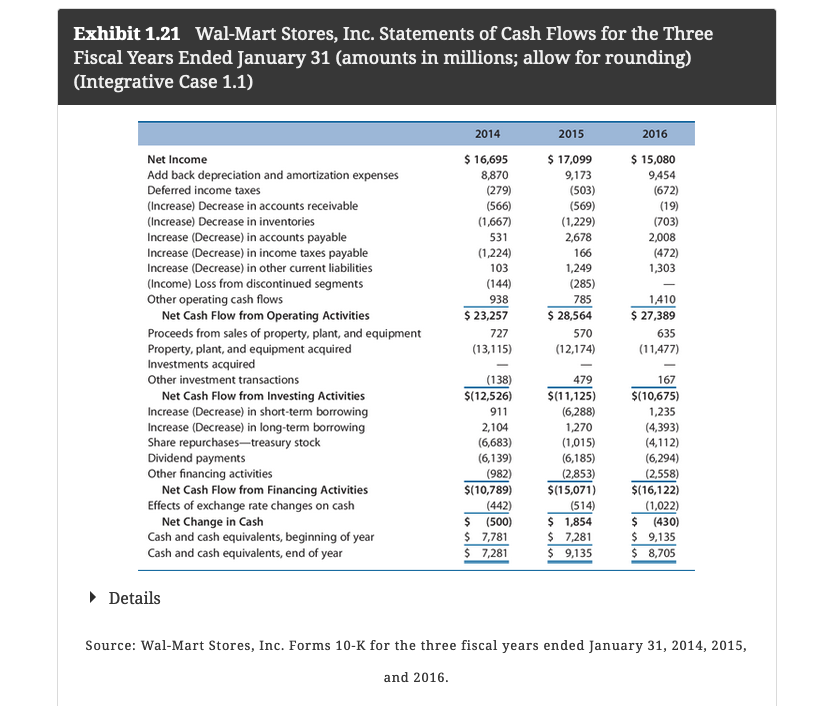
Exhibit 5.26 presents risk ratios for Walmart for 2014 and 2013. Exhibits 1.19,1.20 and 1.21 in Chapter 1 present the financial statements for Walmart. Exhibit 5.26 Walmart Risk Ratios (Integrative Case 5.1) Required a. Compute the values of each of the ratios in Exhibit 5.26 for Walmart for 2015. Walmart had 3,162 million common shares outstanding at the end of fiscal 2015, and the market price per share was $66.36. For 2014 , the comparable shares and price per share were 3,228 million and $84.98, and for 2013 , they were 3,233 million and $74.68, respectively. For days accounts receivable outstanding, use total revenues in your calculations. b. Interpret the changes in Walmart's risk ratios during the three-year period, indicating any areas of concern. Exhibit 1.19 Wal-Mart Stores, Inc. Balance Sheets as of January 31 (amounts in millions; allow for rounding) (Integrative Case 1.1) Details Source: Wal-Mart Stores, Inc. Forms 10-K for the three fiscal years ended January 31, 2014, 2015, and 2016. Exhibit 1.20 Wal-Mart Stores, Inc. Income Statements for the Fiscal Years Ended January 31 (amounts in millions; allow for rounding) (Integrative Case 1.1) Details Source: Wal-Mart Stores, Inc. Forms 10-K for the three fiscal years ended January 31, 2014, 2015, and 2016. Exhibit 1.21 Wal-Mart Stores, Inc. Statements of Cash Flows for the Three Fiscal Years Ended January 31 (amounts in millions; allow for rounding) (Integrative Case 1.1) Exhibit 1.21 Wal-Mart Stores, Inc. Statements of Cash Flows for the Three Fiscal Years Ended January 31 (amounts in millions; allow for rounding) (Integrative Case 1.1) Details Source: Wal-Mart Stores, Inc. Forms 10-K for the three fiscal years ended January 31, 2014, 2015, and 2016. Exhibit 5.26 presents risk ratios for Walmart for 2014 and 2013. Exhibits 1.19,1.20 and 1.21 in Chapter 1 present the financial statements for Walmart. Exhibit 5.26 Walmart Risk Ratios (Integrative Case 5.1) Required a. Compute the values of each of the ratios in Exhibit 5.26 for Walmart for 2015. Walmart had 3,162 million common shares outstanding at the end of fiscal 2015, and the market price per share was $66.36. For 2014 , the comparable shares and price per share were 3,228 million and $84.98, and for 2013 , they were 3,233 million and $74.68, respectively. For days accounts receivable outstanding, use total revenues in your calculations. b. Interpret the changes in Walmart's risk ratios during the three-year period, indicating any areas of concern. Exhibit 1.19 Wal-Mart Stores, Inc. Balance Sheets as of January 31 (amounts in millions; allow for rounding) (Integrative Case 1.1) Details Source: Wal-Mart Stores, Inc. Forms 10-K for the three fiscal years ended January 31, 2014, 2015, and 2016. Exhibit 1.20 Wal-Mart Stores, Inc. Income Statements for the Fiscal Years Ended January 31 (amounts in millions; allow for rounding) (Integrative Case 1.1) Details Source: Wal-Mart Stores, Inc. Forms 10-K for the three fiscal years ended January 31, 2014, 2015, and 2016. Exhibit 1.21 Wal-Mart Stores, Inc. Statements of Cash Flows for the Three Fiscal Years Ended January 31 (amounts in millions; allow for rounding) (Integrative Case 1.1) Exhibit 1.21 Wal-Mart Stores, Inc. Statements of Cash Flows for the Three Fiscal Years Ended January 31 (amounts in millions; allow for rounding) (Integrative Case 1.1) Details Source: Wal-Mart Stores, Inc. Forms 10-K for the three fiscal years ended January 31, 2014, 2015, and 2016
Step by Step Solution
There are 3 Steps involved in it
Step: 1

Get Instant Access to Expert-Tailored Solutions
See step-by-step solutions with expert insights and AI powered tools for academic success
Step: 2

Step: 3
Ace Your Homework with AI
Get the answers you need in no time with our AI-driven, step-by-step assistance
Get Started
Economic Influences On The Development Of Accounting In Firms
Authors: George J. Staubus
1st Edition
0367721325, 9780367721329